A Journey in Data Modelling:
My Teach First Ambassador Project
Friday 7th August 2026
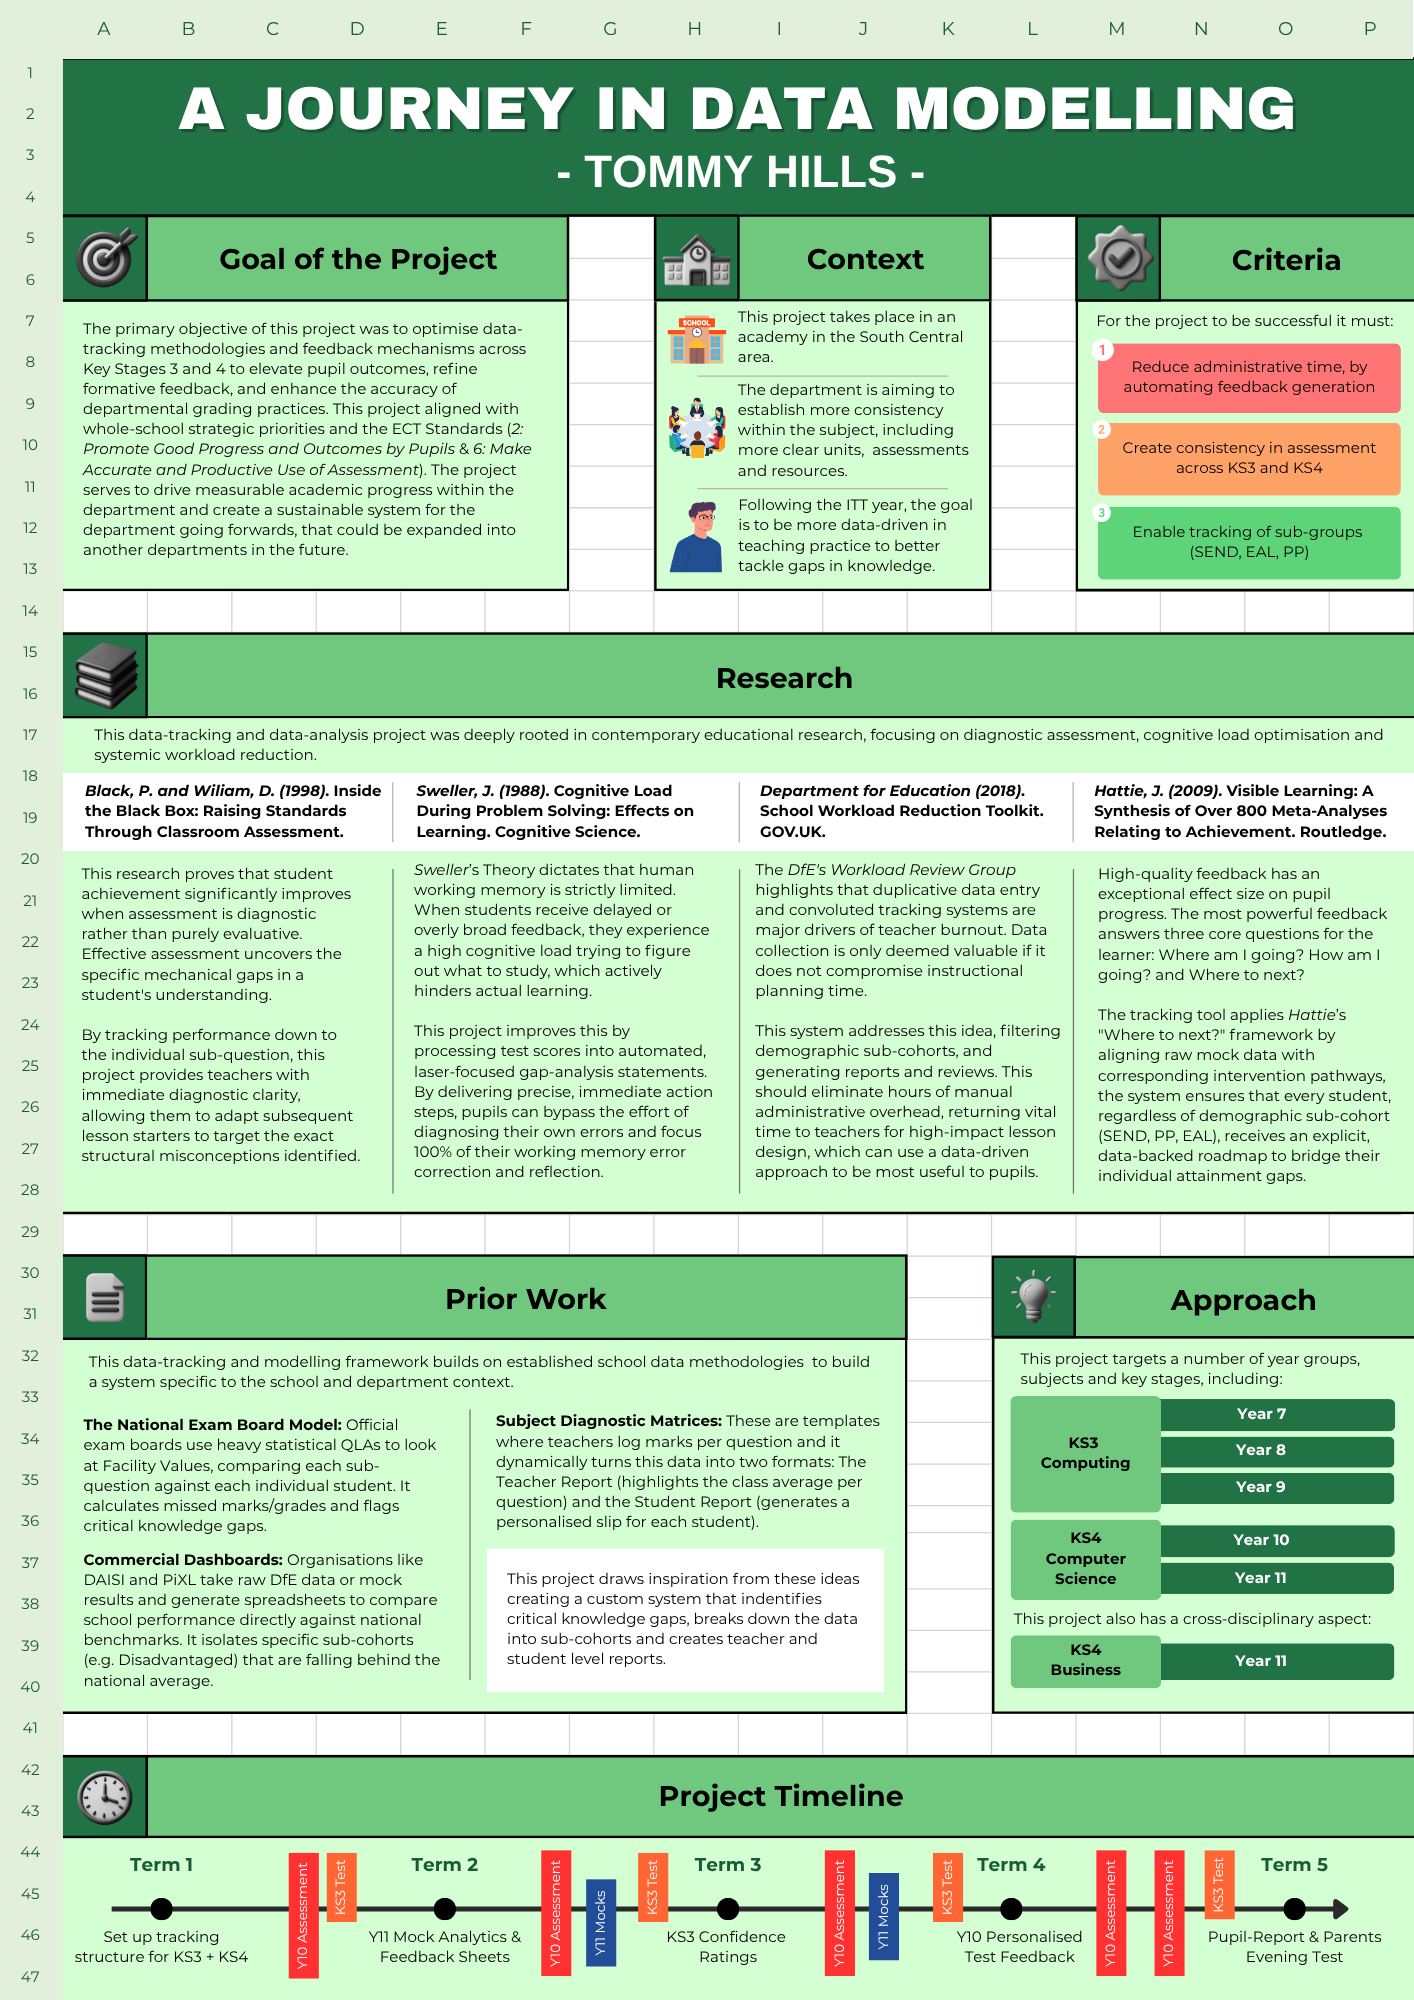
When I left university for a career in education, I made a sweeping statement. I had decided that software engineering was not for me and wanted to focus more on academia, education and being a teacher. However, the universe has a funny way of working. During my Teach First Ambassador Project, I ended up undertaking what was essentially a massive “software engineering” task to overhaul how we track data, analyse assessments, and provide feedback in the Computing and IT department.
The Catalyst for Change
The driving force for this project emerged during my initial teacher training year. When we were entering Key Stage 3 grades, we were using our school’s grading system of Emerging, Developing, Securing, Mastering, and Advanced. However, these were based largely on class observation rather than qualitative assessment.
While those grades were by no means incorrect, the lack of rigorous data made consistency incredibly difficult, across classes and across data drops throughout the key checkpoints in an academic year. It also led to muddier conversations at parents' evenings. When asked why a pupil was graded as 'Developing', the response was qualitative descriptions of in-lesson observations. I wanted to build a system that was rooted in evidence, aligning with our whole-school priorities on data and the Early Career Teacher (ECT) standards (specifically standard 2: Promote Good Progress and Outcomes by Pupils, and standard 6: Make Accurate and Productive Use of Assessment).
Industry Models
Before building my spreadsheet solution, I looked closely at how the education sector already handles data modelling.
The National Exam Board Model
Official exam boards use statistical Question Level Analysis (QLA) to look at Facility Values, comparing each sub-question against individual student performance. This calculates missed marks and flags critical knowledge gaps.
Commercial Dashboards
Organisations like DAISI and PiXL take raw Department for Education data or mock results and generate spreadsheets to compare school performance directly against national benchmarks, isolating sub-cohorts falling behind the average.
The Research
To ensure this project was genuinely effective, the entire data-tracking and analysis framework was deeply rooted in contemporary educational research. I wanted to move away from tracking as a simple administrative requirement and transform it into a pedagogical tool.
- Diagnostic Assessment: Black and Wiliam's 'Inside the Black Box' highlights that assessment only significantly improves achievement when it is diagnostic rather than purely evaluative. By tracking performance down to the individual sub-question, teachers gain immediate clarity on mechanical gaps in a student's understanding.
- Cognitive Load Theory: Sweller dictates that human working memory is strictly limited. When pupils receive overly broad feedback, they experience a high cognitive load trying to figure out what to study, which actively hinders learning. This system automates laser-focused gap analysis, allowing pupils to bypass the effort of diagnosing their own errors and focus their working memory entirely on correction.
- Actionable Feedback: John Hattie's 'Visible Learning' proves that the most powerful feedback answers three core questions: Where am I going?, How am I going?, and Where to next?. This tracking tool aligns raw mock data with corresponding intervention pathways to give pupils a clear roadmap.
- Principles of Instruction: Barak Rosenshine's research emphasises the importance of daily review and guiding student practice. The data generated by this project directly informs the 'Do Now' retrieval tasks at the start of subsequent lessons.
- Data-Based Decision Making: Schildkamp and Lai's research demonstrates that sustainable data use in schools must be embedded into the curriculum cycle, ensuring that data is not just collected, but directly informs future lesson planning and pupil interventions.
- Workload Reduction: Guided by the Department for Education's Workload Reduction Toolkit, the system was built to eliminate duplicative data entry. Data collection is only valuable if it does not compromise instructional planning time, so this tool handles the administrative overhead automatically.
Structuring the Data
To make this workflow a reality, I transitioned our physical and digital assessments into Google Forms to make data entry seamless. Once submitted, this data imports directly into Google Sheets. Treating a spreadsheet like a type of “software engineering project” required rigourous chunking of information to maintain focus, optimise processing speed, and prevent the interface from becoming cluttered.
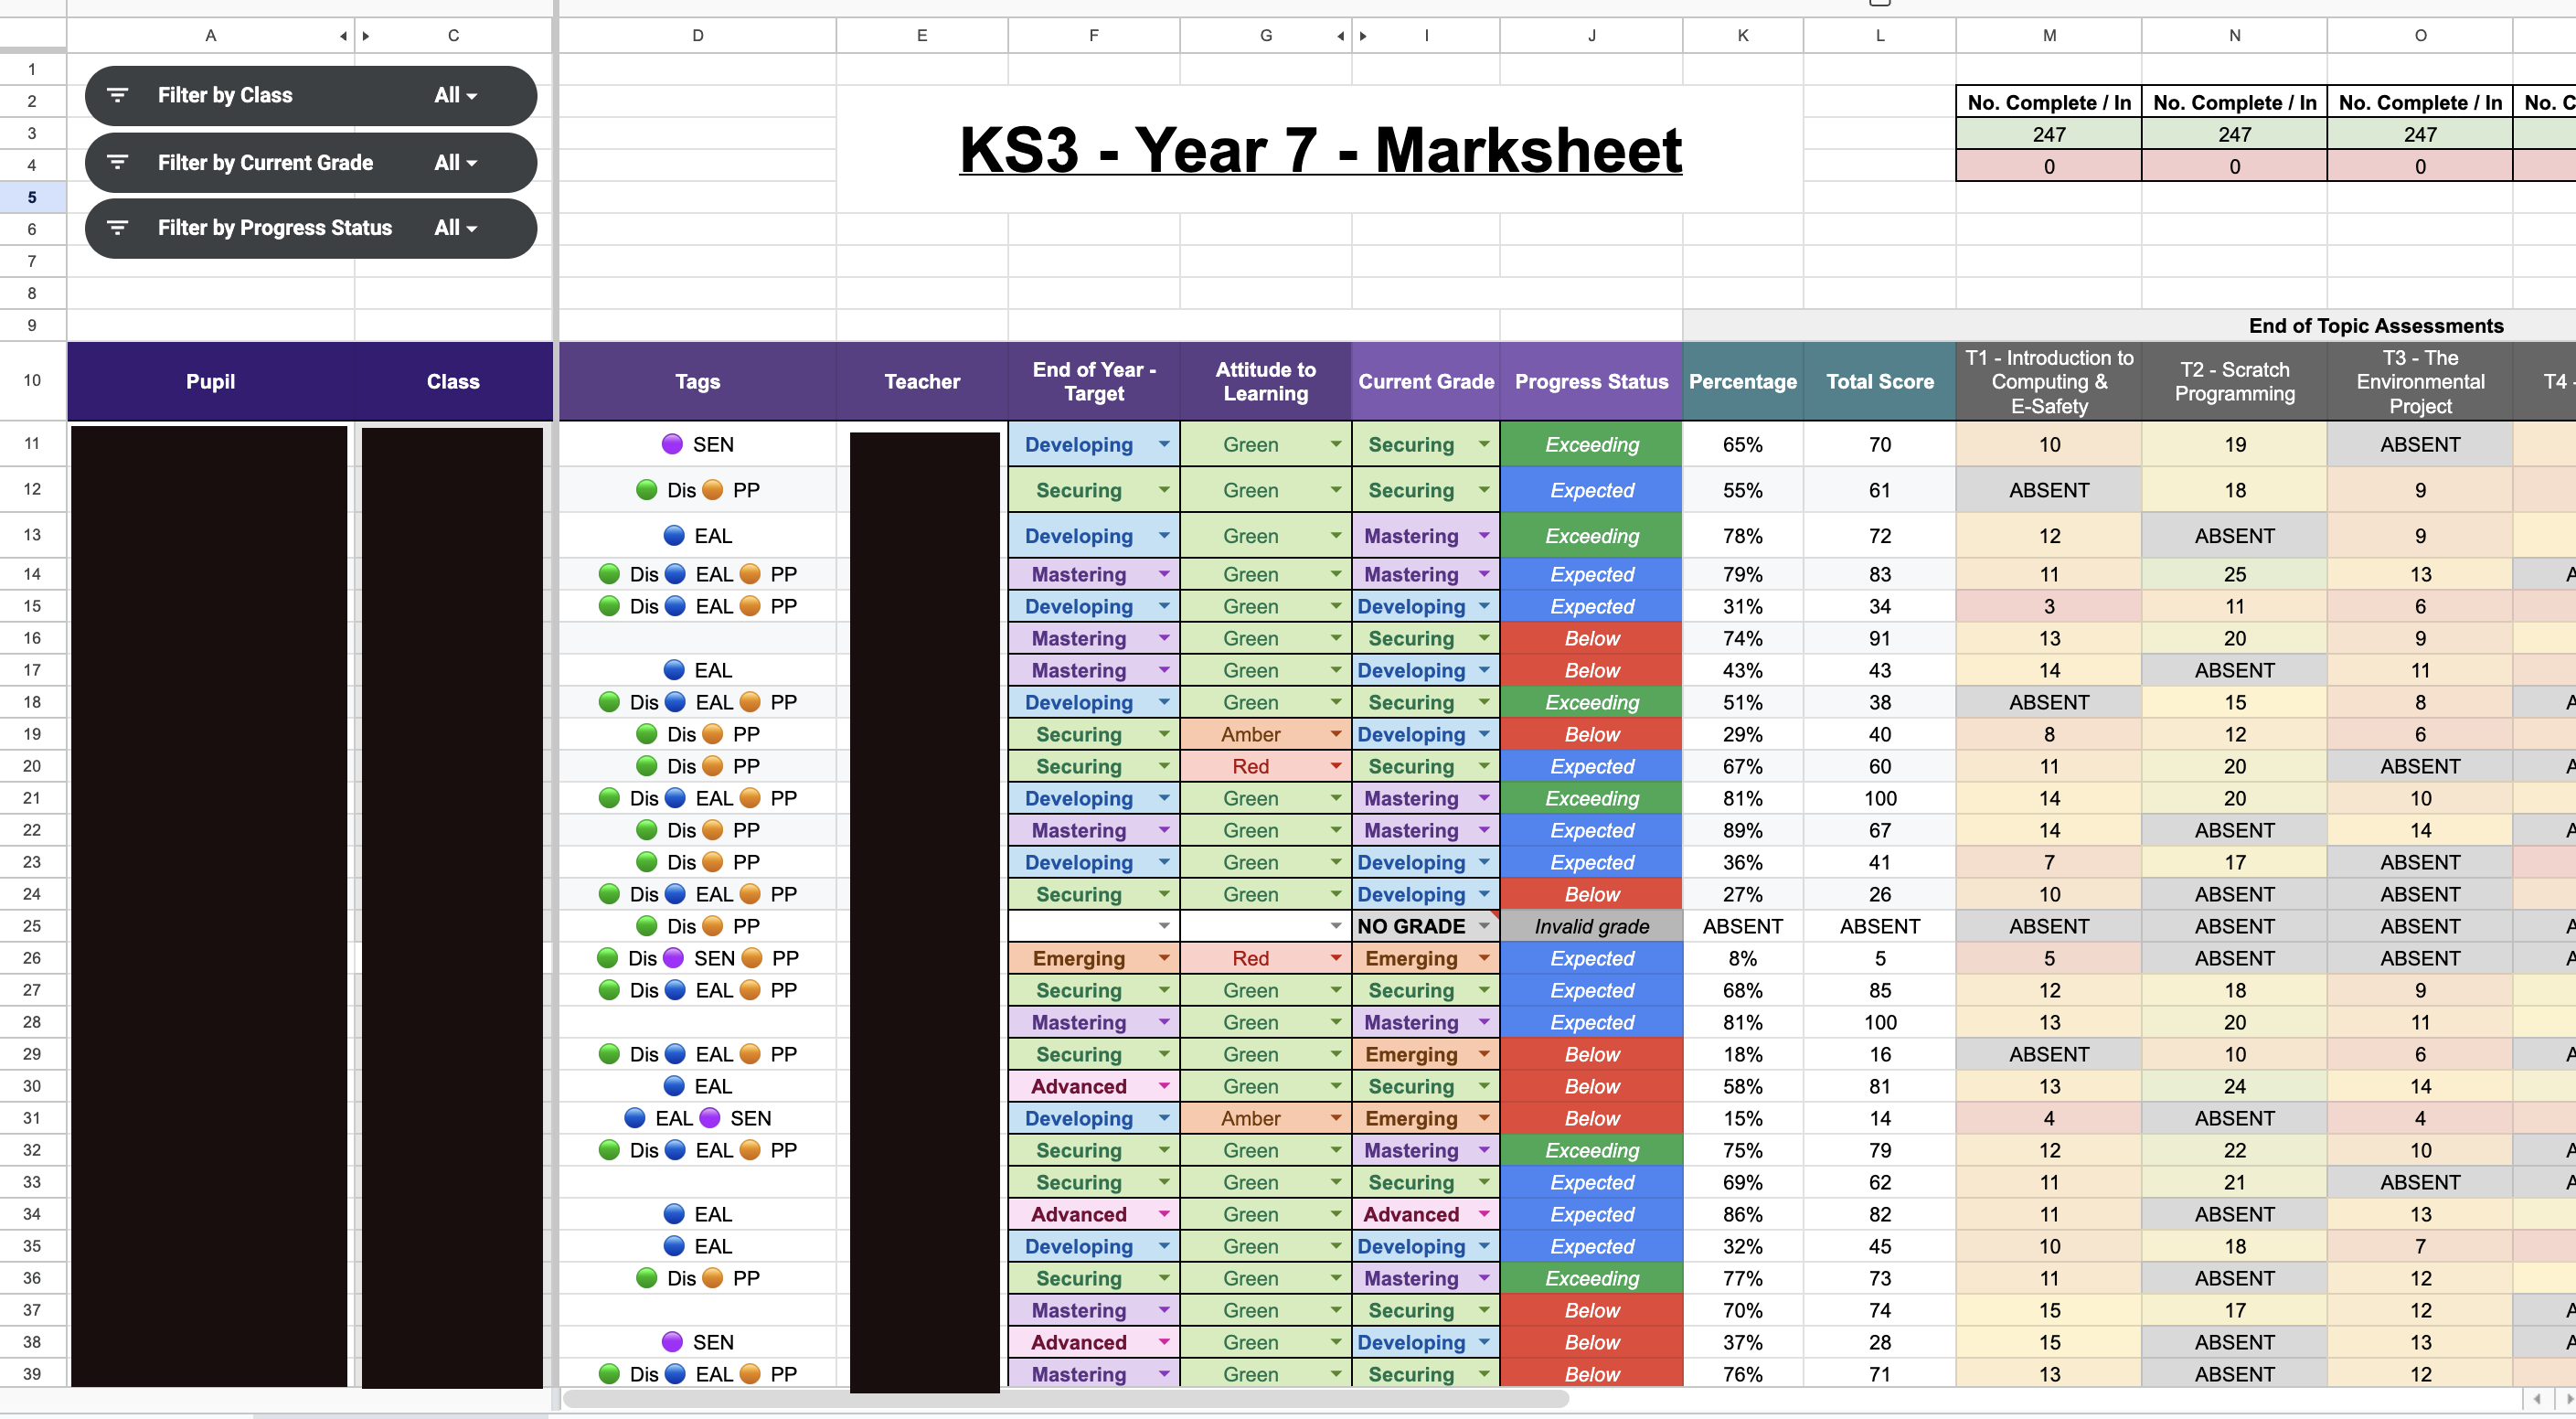
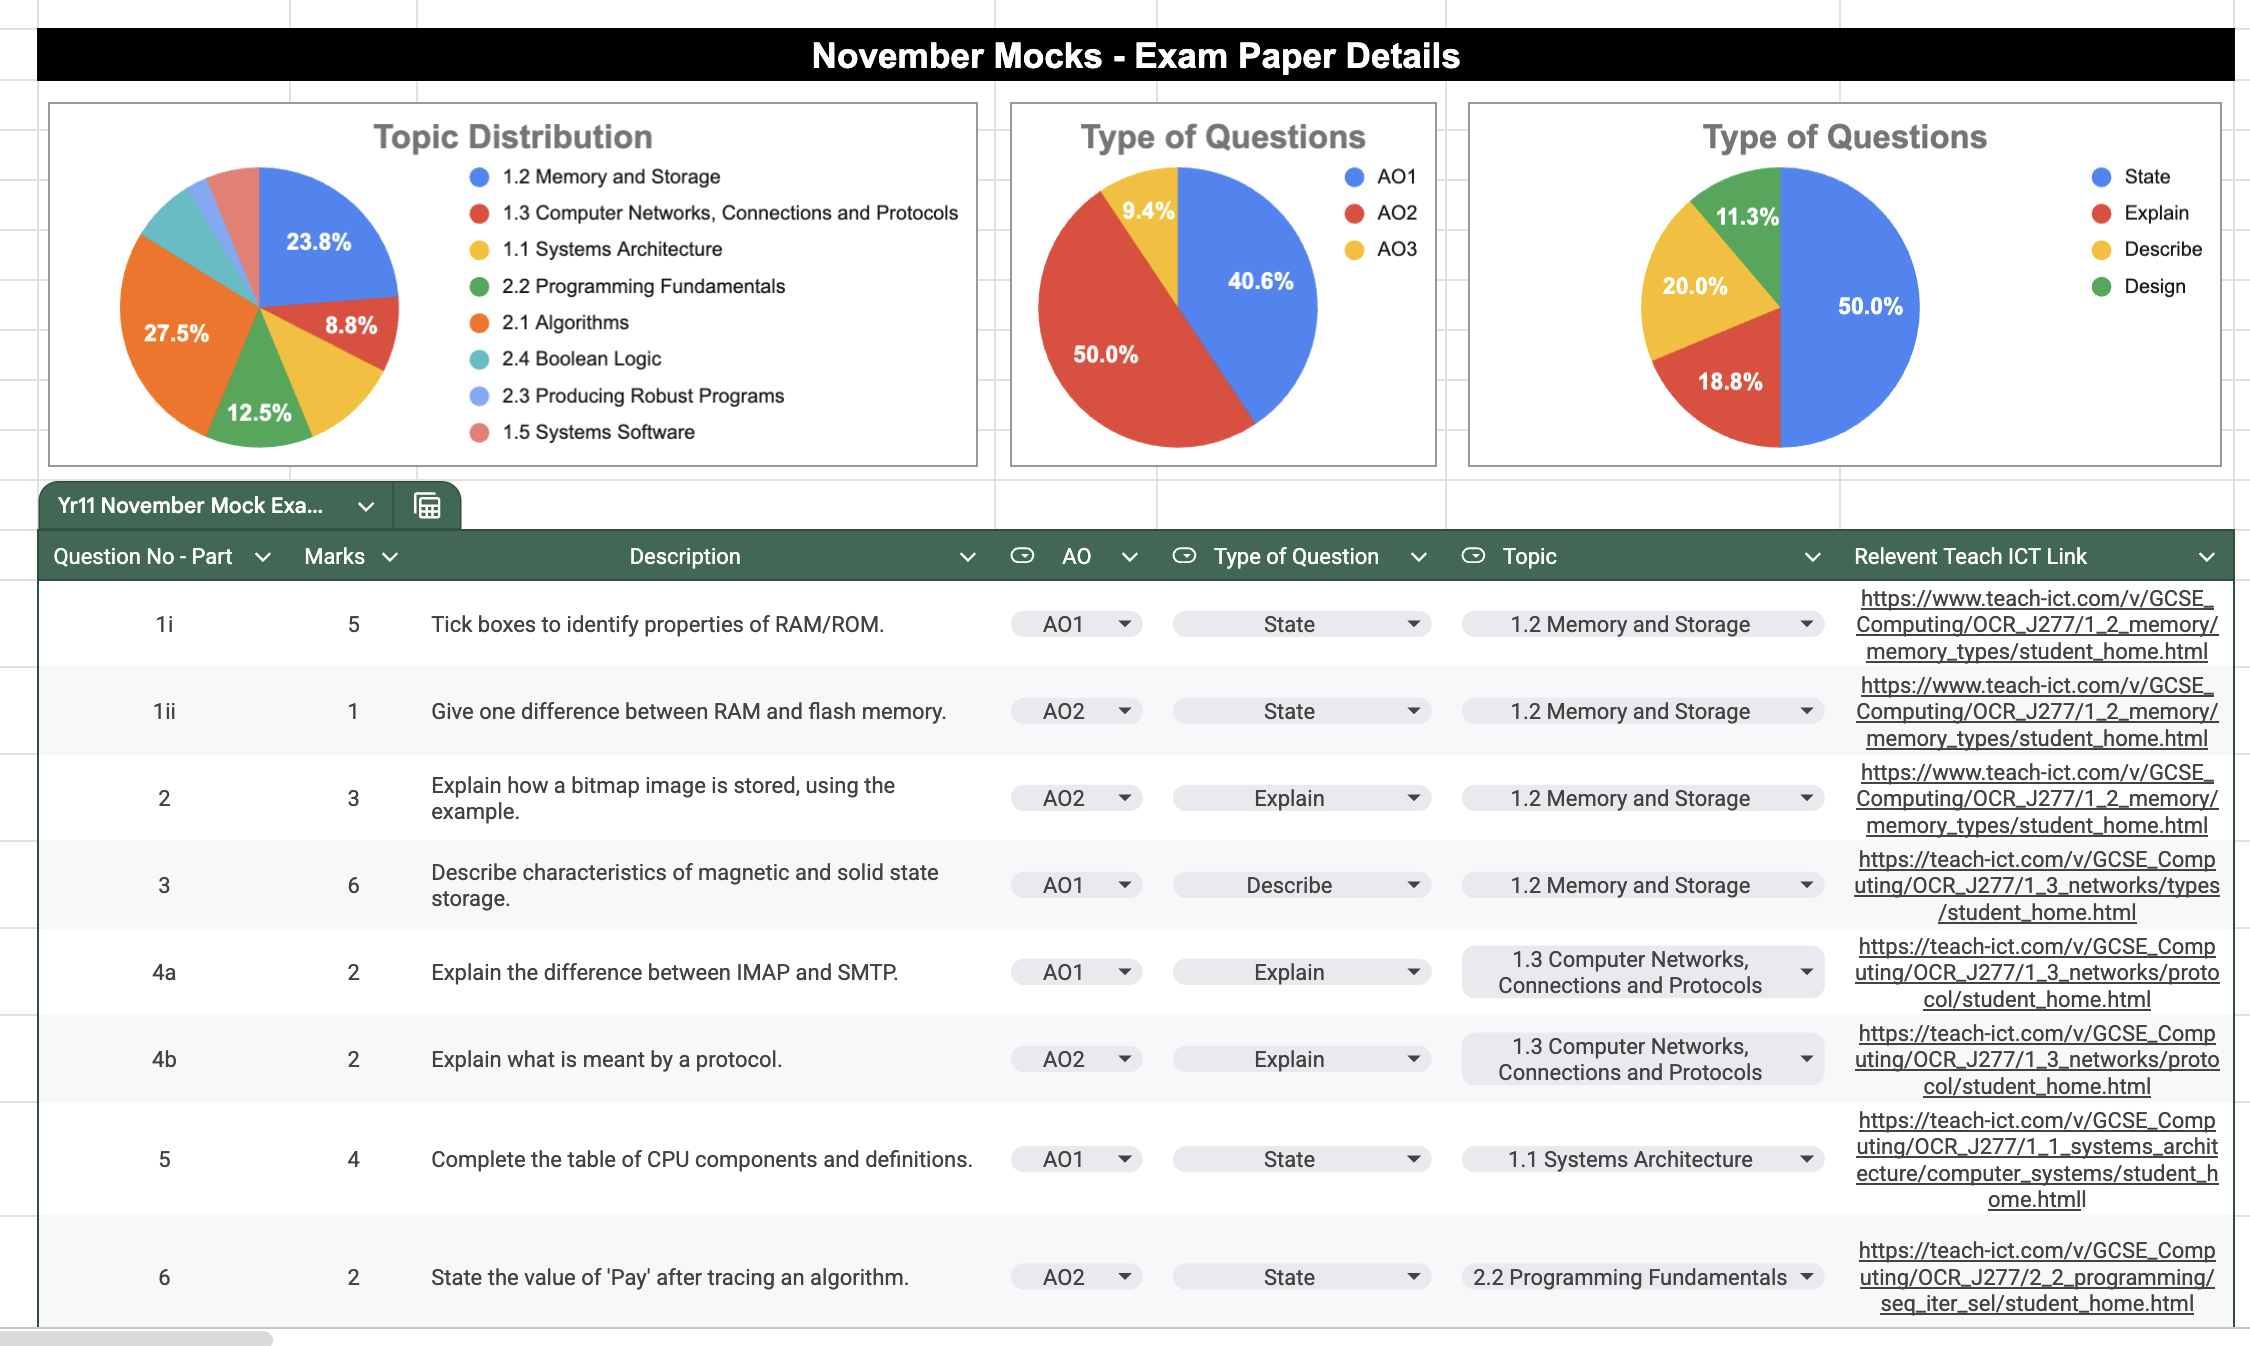
I separated the data into highly specific, relational sheets. The 'Pupil Details (Faculty)' sheet acted as our central relational database. It pulls information directly from our school register database to populate demographic information, Special Educational Needs (SEN) statuses, English as an Additional Language (EAL) flags, and target grades automatically. For KS4 mock exams, the 'EXAM DETAILS' sheet was strictly for mapping out exam papers, listing the marks, topics, and assessment objectives for every single question.
To connect these elements, I relied on several complex spreadsheet functions:
- ARRAYFORMULA: This function is an absolute game changer for school environments where class lists are constantly in flux. Instead of manually dragging a calculation down hundreds of rows, wrapping a calculation in an ARRAYFORMULA at the very top of a column forces the math to apply to the entire array automatically.
- LET and FILTER: These functions were vital for cleaning up the data views and creating dynamic reports. The LET function allows you to assign names to intermediate calculation results within a formula. I paired this with the FILTER function to dynamically generate lists of pupils underperforming in specific areas.
- INDEX, MATCH, and VLOOKUP: These functions formed the connective tissue of the database. They were used to cross-reference a pupil's raw exam scores with their demographic profile and the specific exam mark scheme.
- COUNTIFS and Conditional Formatting: These tools provided the visual aspect of the project. I used COUNTIFS to aggregate data, calculating exactly how many pupils fell into specific attainment bands. Conditional formatting then provided the visual Red, Amber, Green (RAG) tracking overlays.
Tailored Approaches to KS3 vs KS4
The design needed to adapt based on the age group and assessment style.
Year 10 Unit Tracking
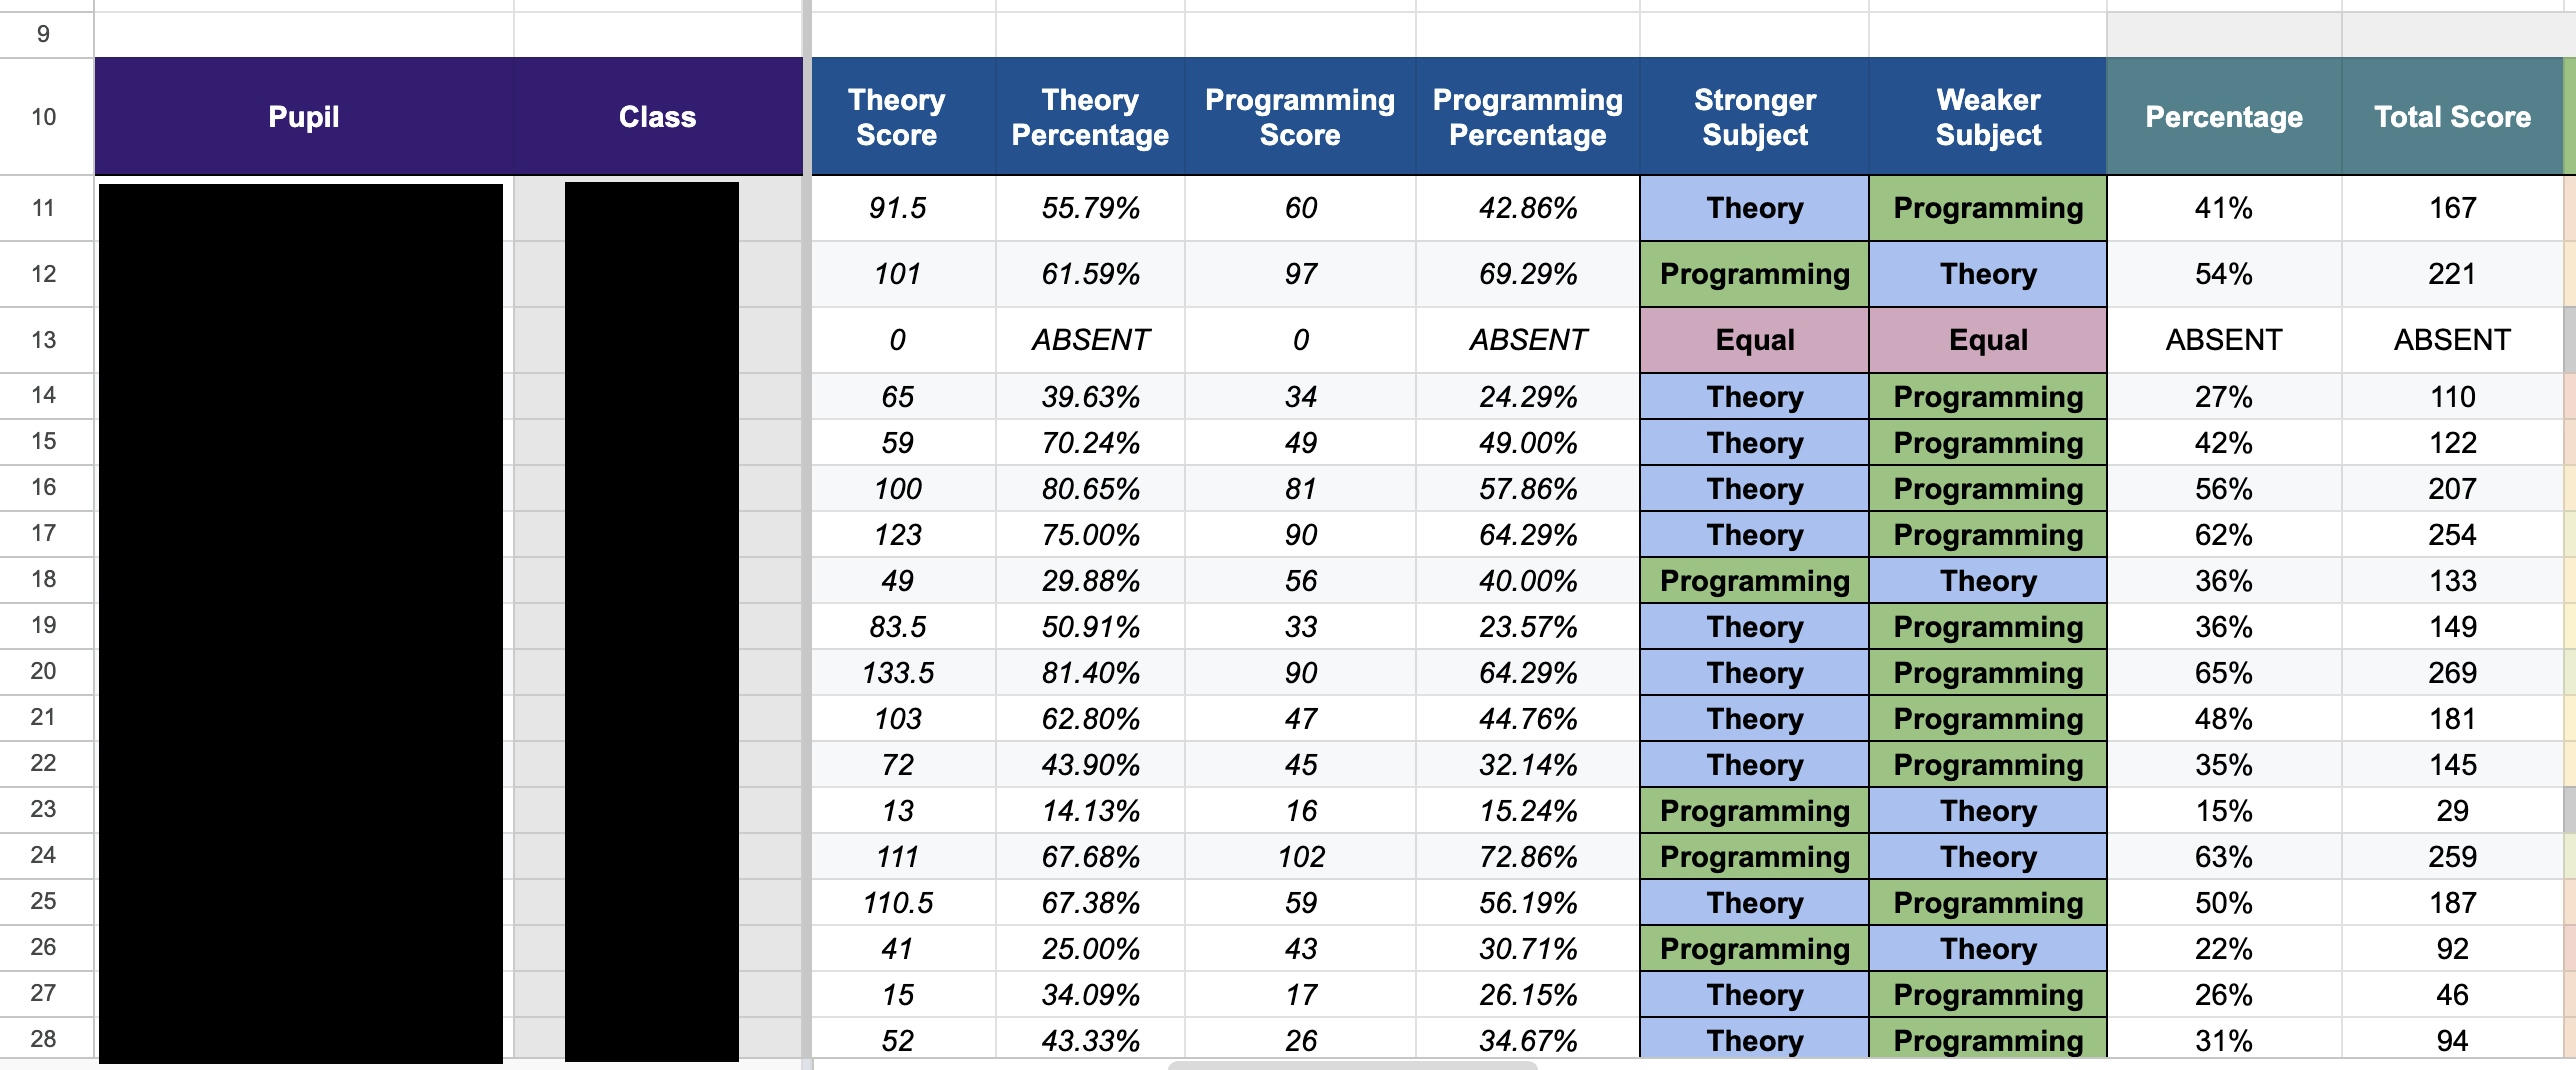
The system distinctly split performance into a 'Theory - Assessments Average' and a 'Programming - Assessments Average'. This clearly identified whether a pupil was highly capable in Python coding but struggling with the theory content, such as network topologies, allowing for highly targeted interventions.
Year 11 Mock Analysis
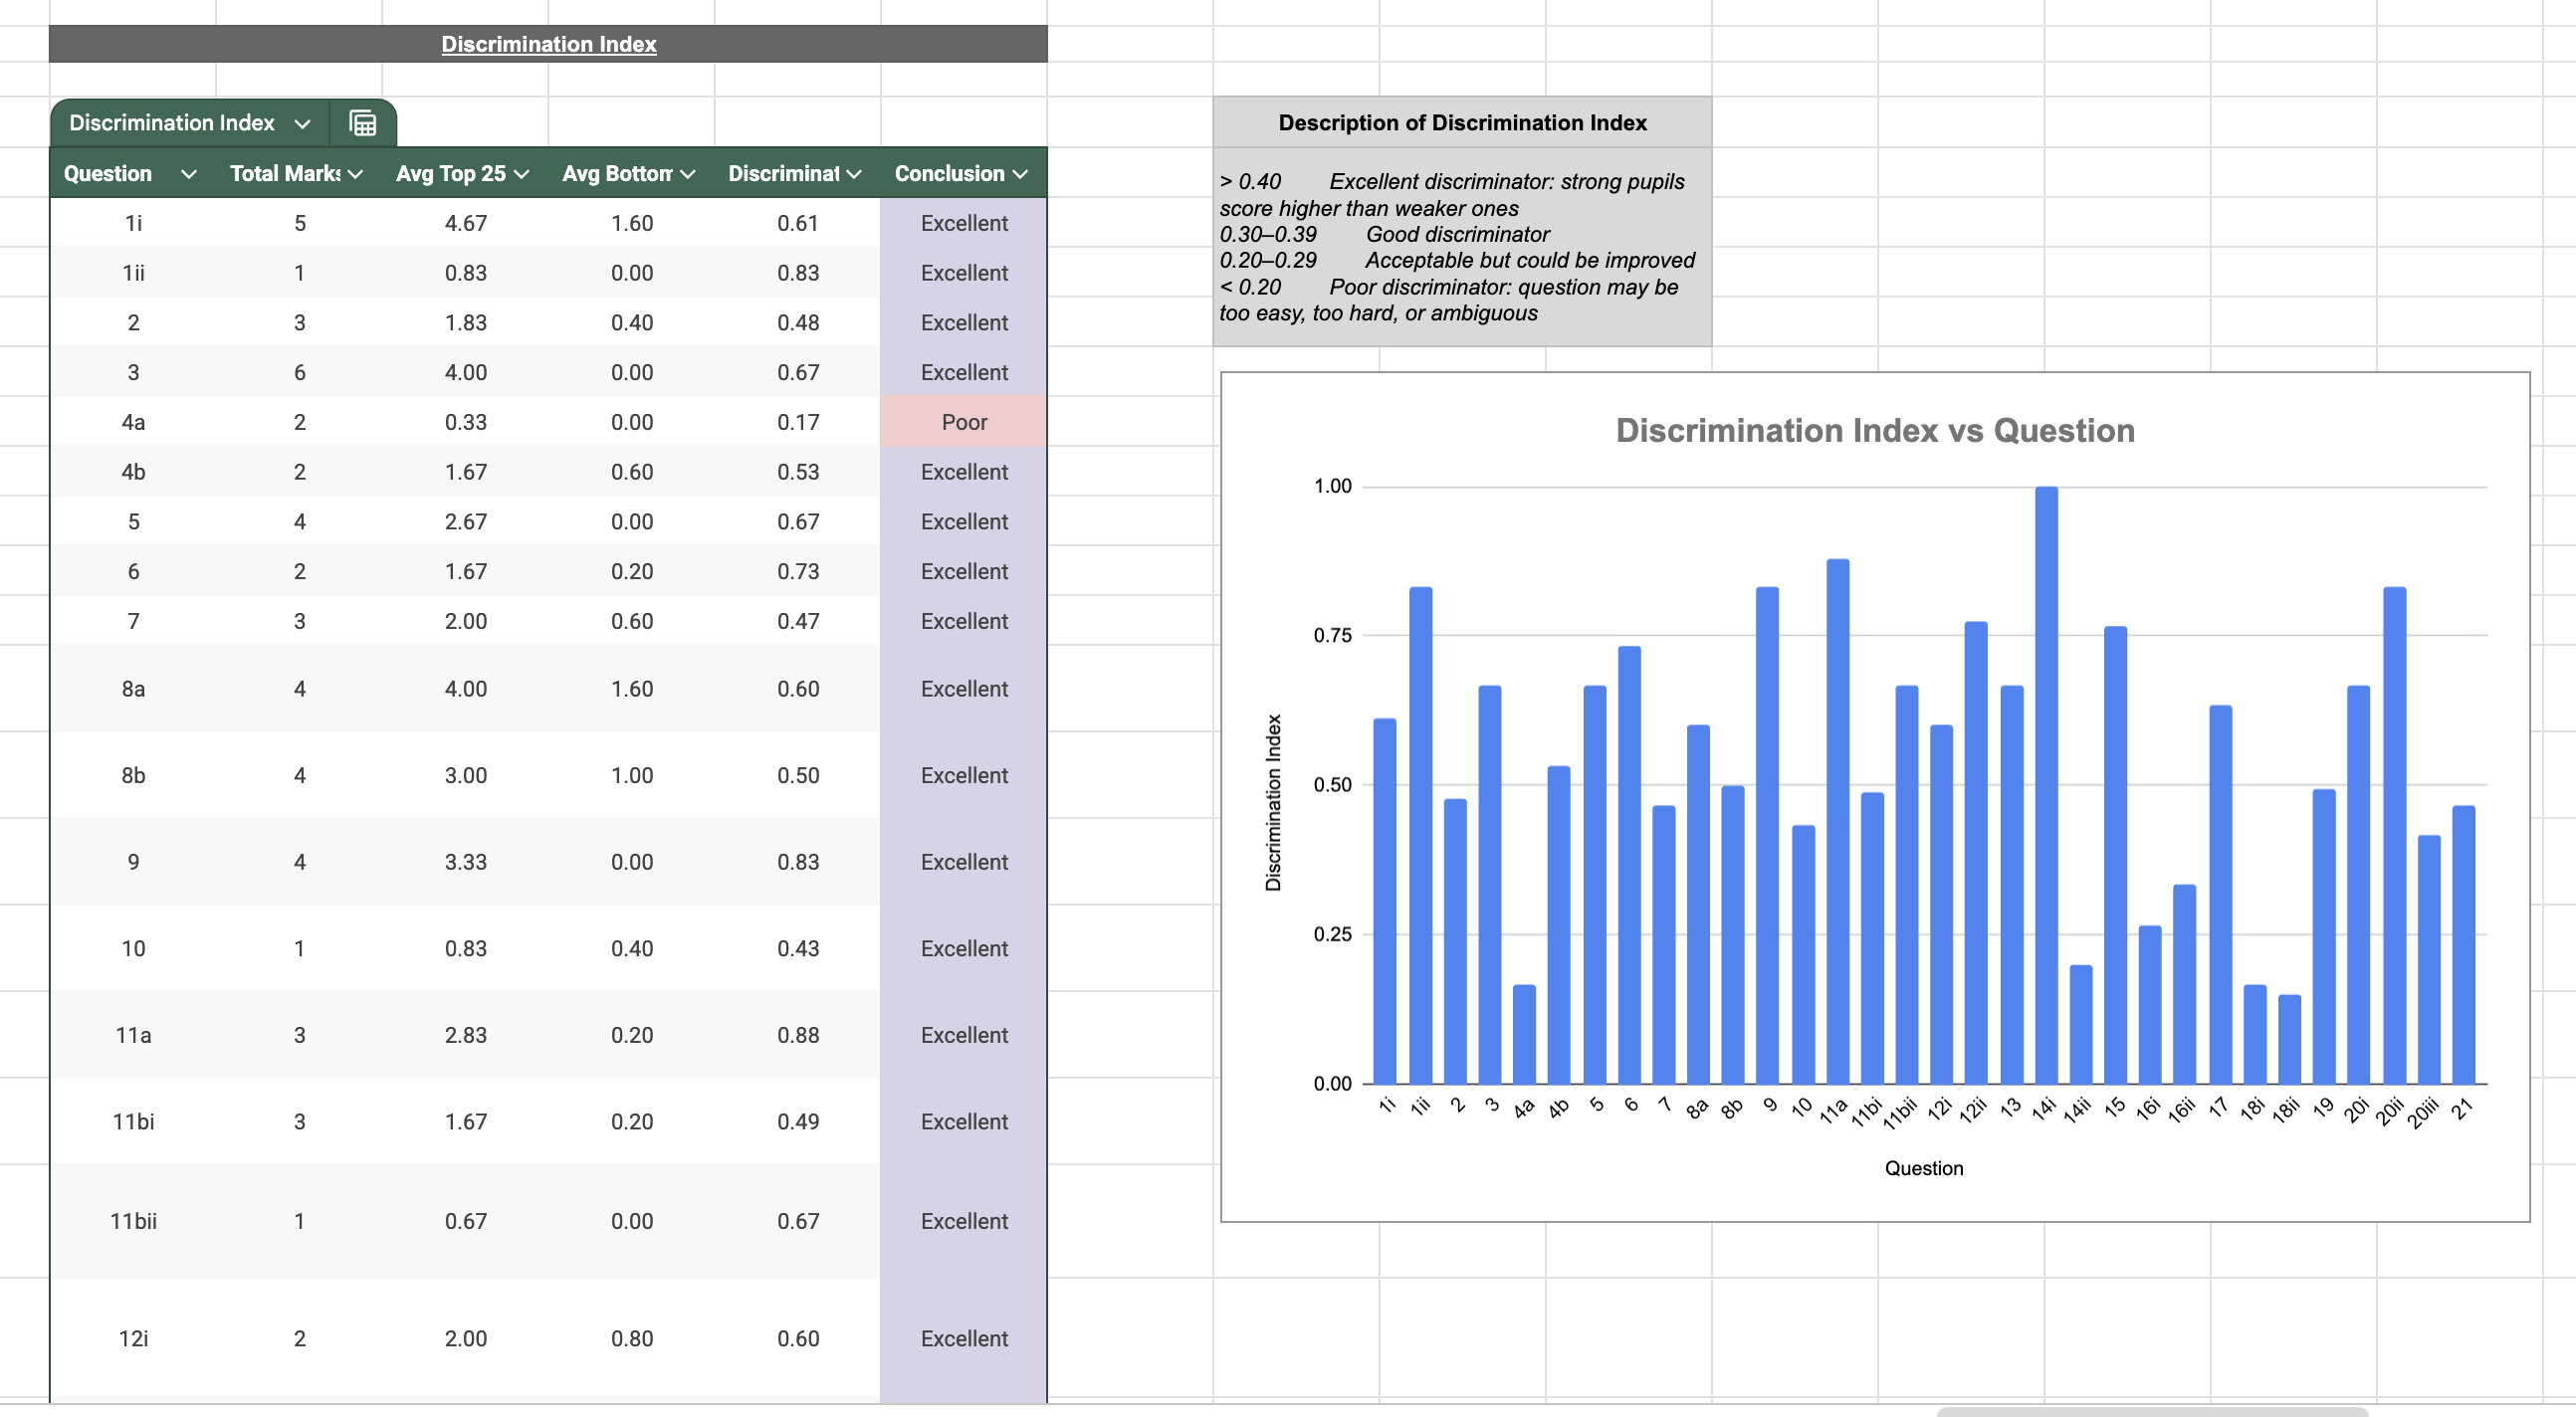
For the November mock exams, the system analysed performance across all questions, monitoring variations across demographic sub-cohorts, including SEN, Pupil Premium (PP), Disadvantaged (DIS), EAL, and various prior attainment bands. We also used the data to calculate the discrimination index, proving to senior leadership that the chosen questions in our mock exam successfully distinguished between high-performing and low-performing pupils.
Feedback Systems
Data collection is only half the battle, returning that data to the pupils is where the impact happens.
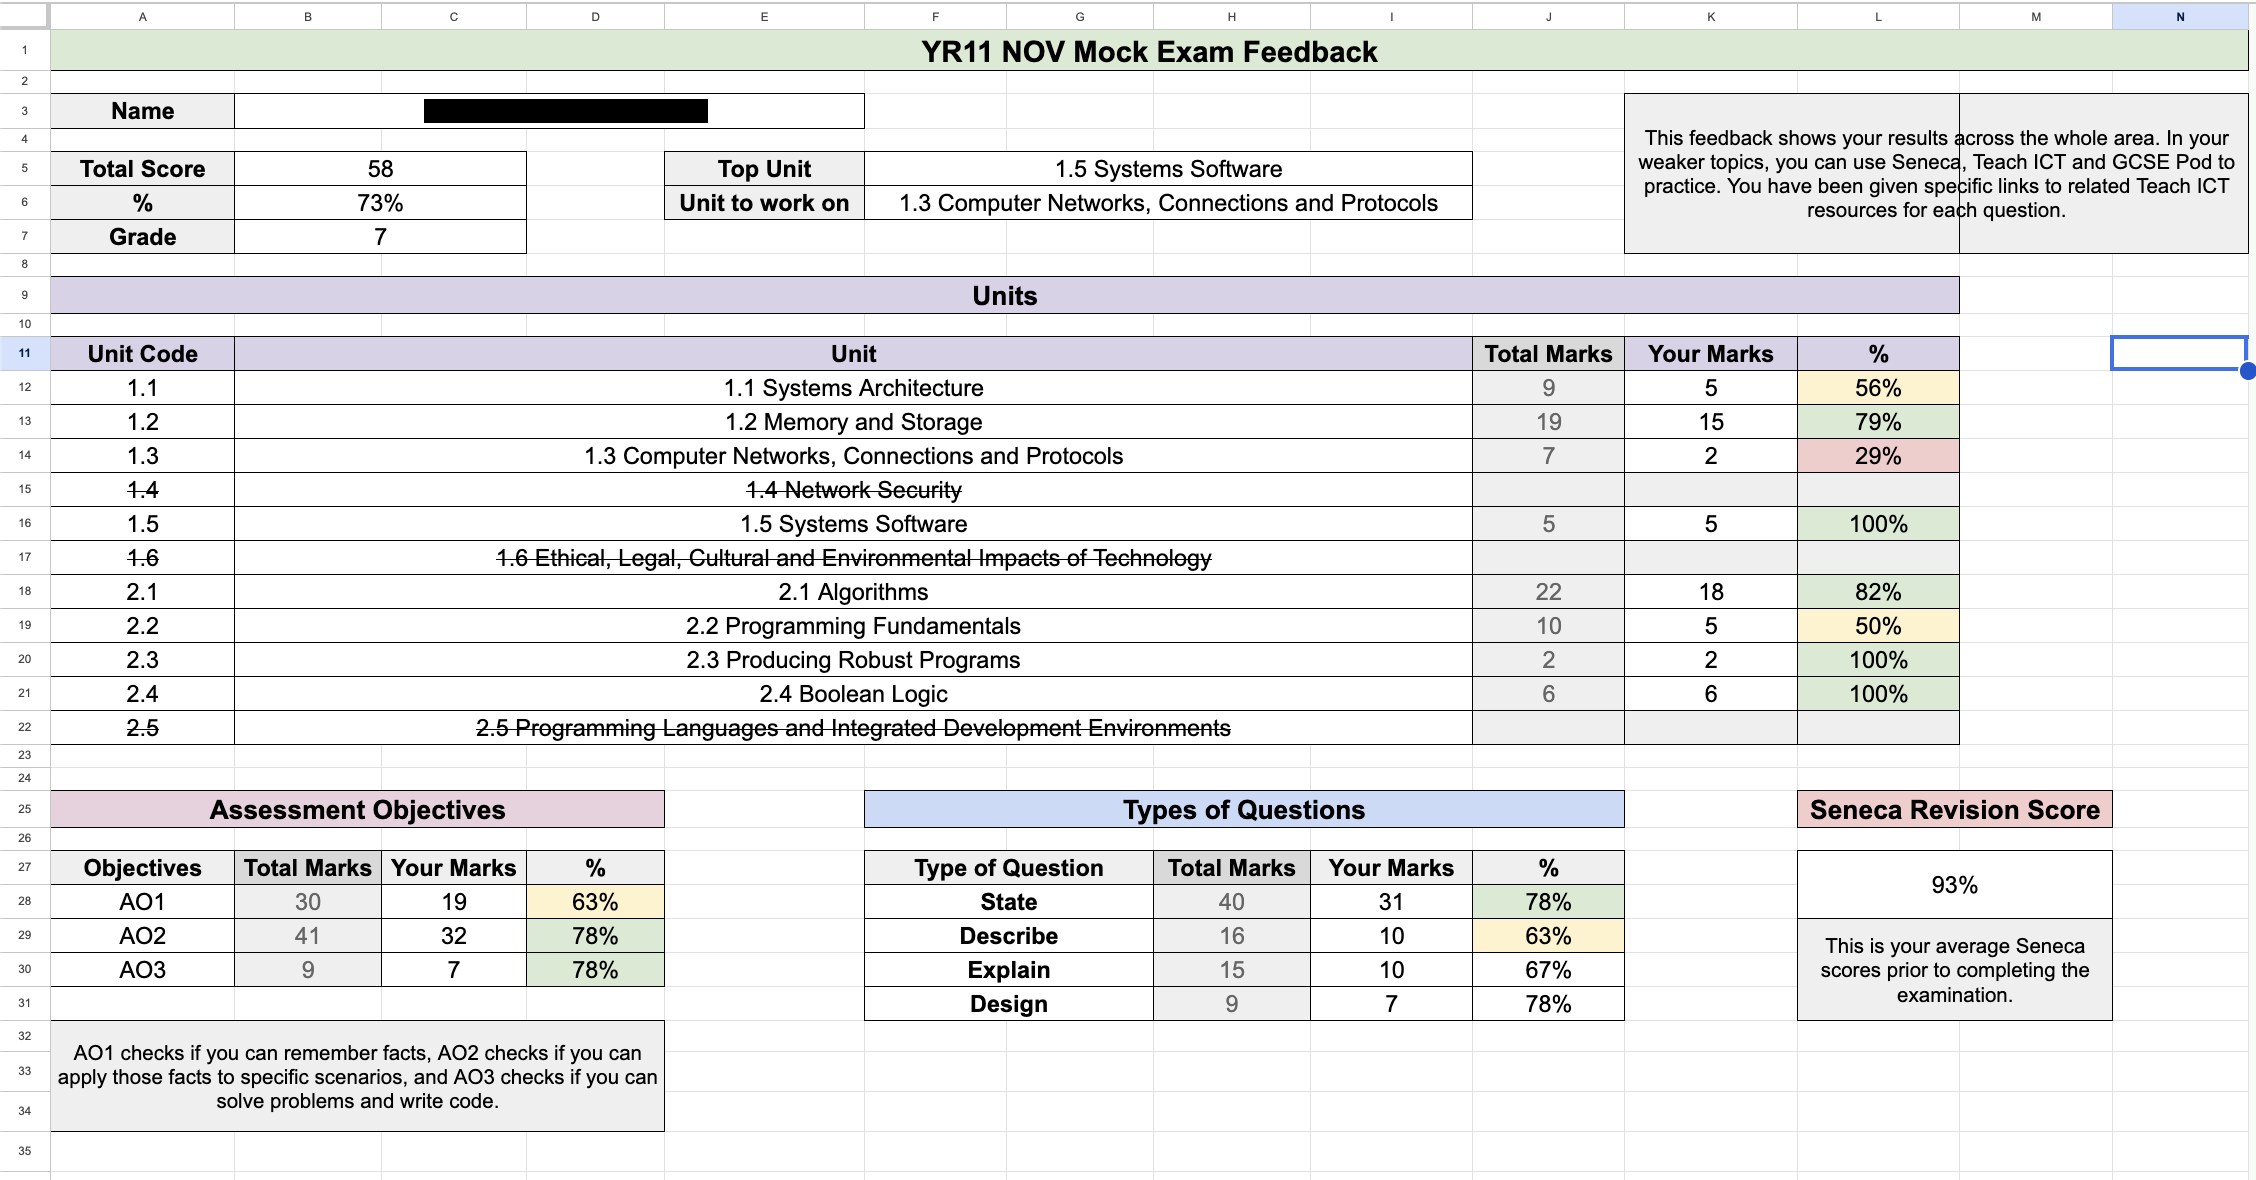
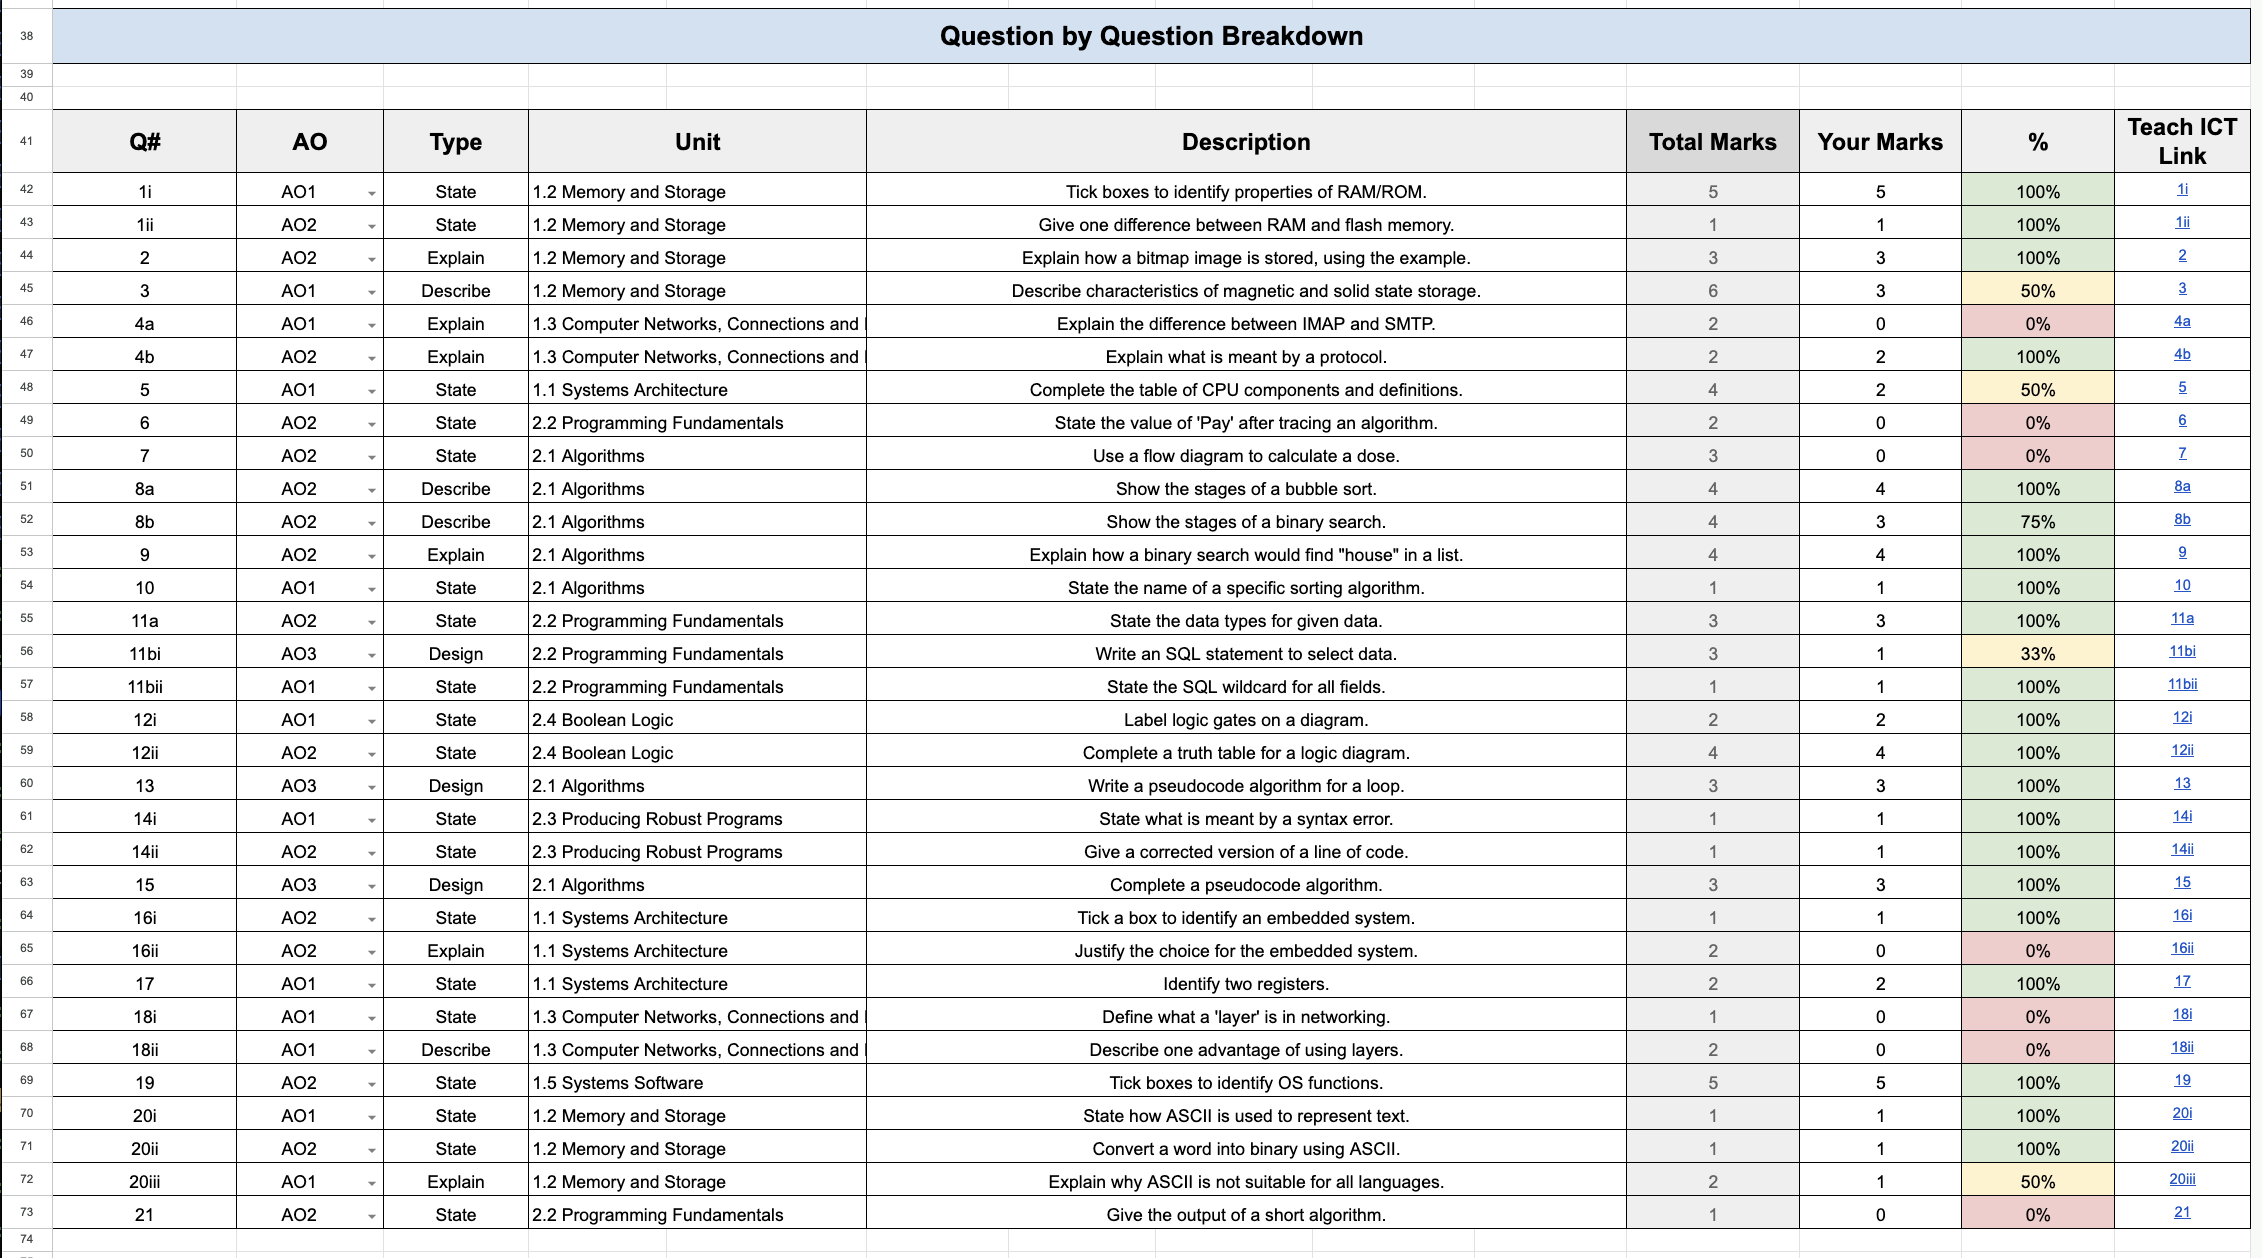
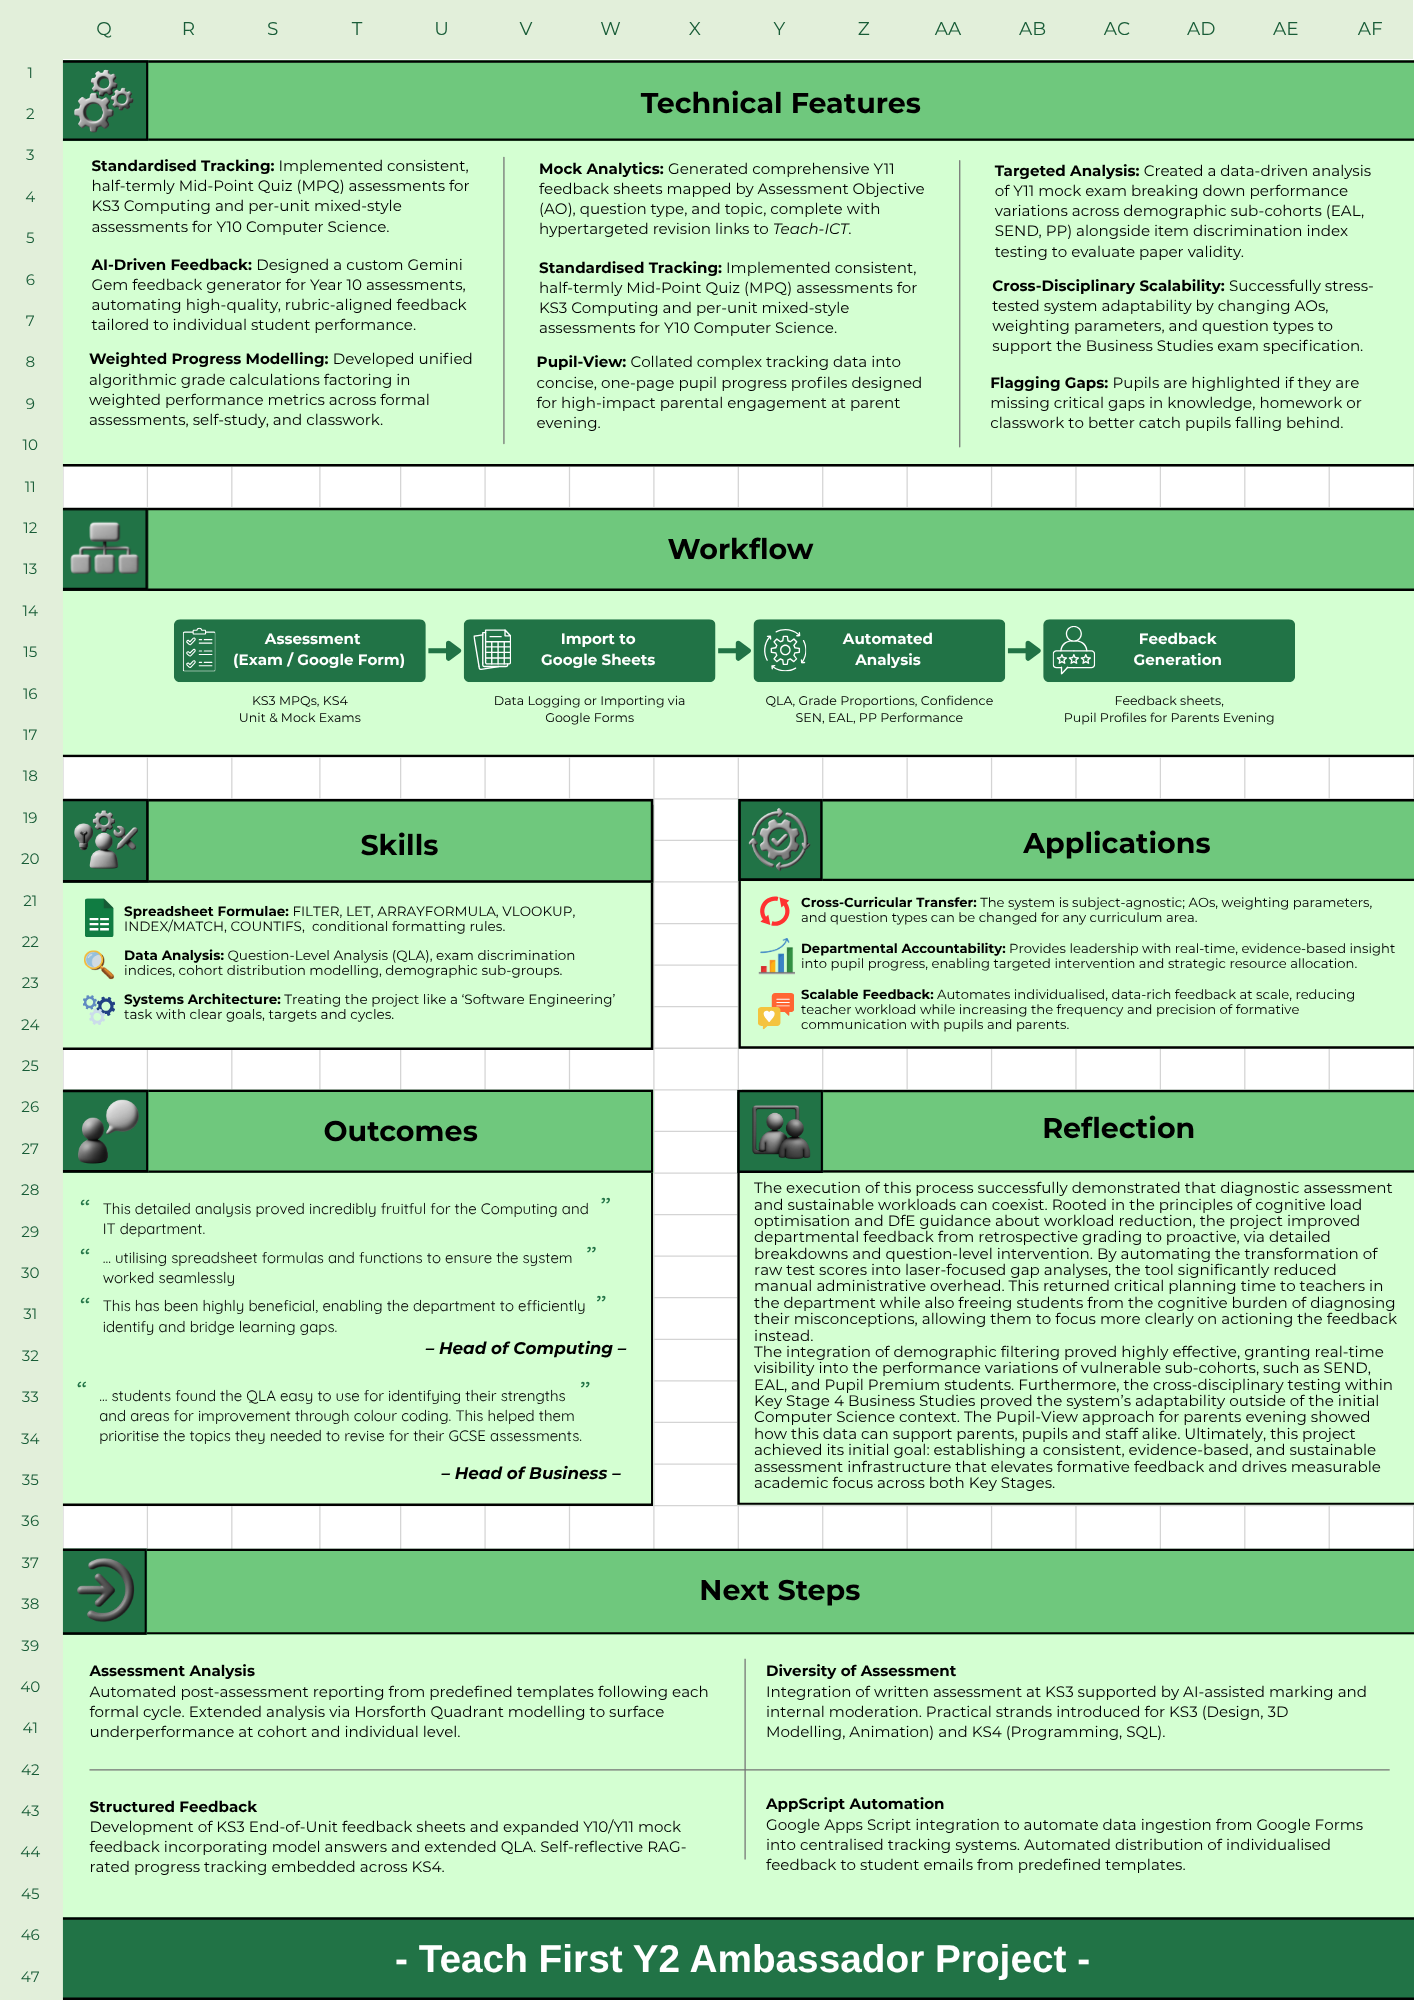
- Year 11 Feedback Sheets: Following the mocks, every pupil received a highly detailed, automatically generated printout. This document broke down their performance question by question, mapped against Assessment Objectives (AO1, AO2), and provided hyper-targeted revision links to Teach-ICT for their weakest areas.
- Year 10 AI-Driven Formative Feedback: For Y10 unit assessments, I took the automation a step further by utilising a custom AI prompt. Using Gemini, an AI model that is approved at a Trust level, the system translated raw numbers into a human-readable, personalised paragraph explaining exactly why marks were awarded or dropped.
- Exam Feedback: Data is useless if it does not impact classroom instruction. Using the QLA reports, I designed a consistent lesson structure for exam feedback, creating a feedback-action loop of test-reflect-apply.
Improved Parents' Evening Interactions
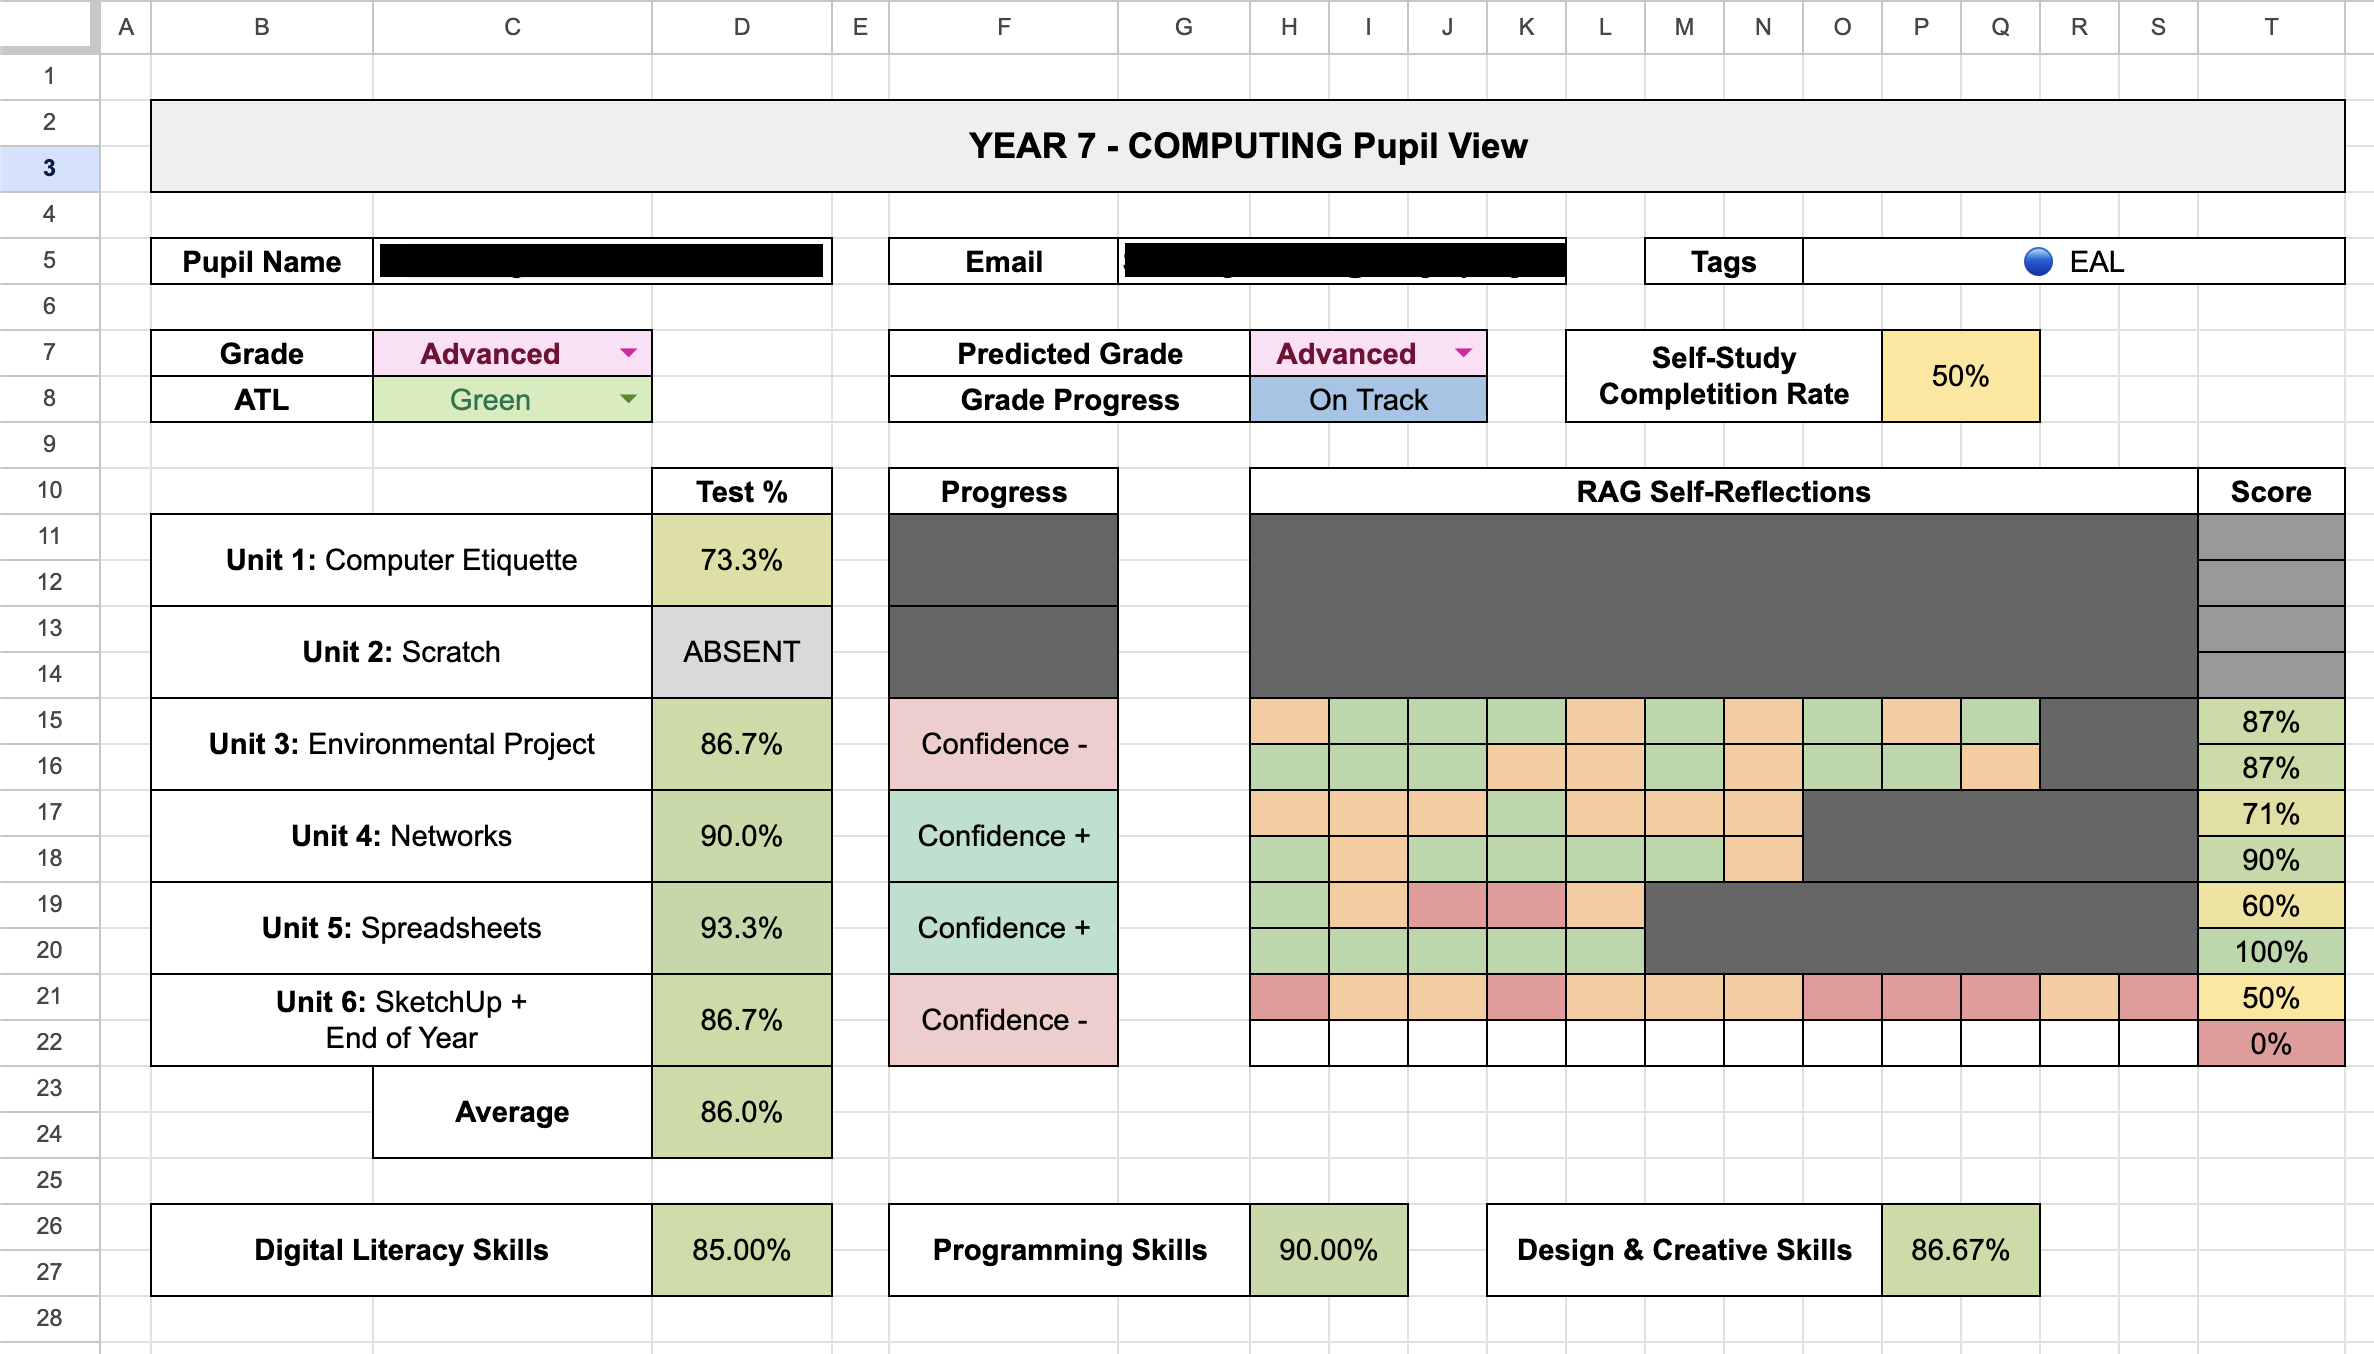
I built a "Pupil View" dashboard specifically for teacher-parent consultations. By simply typing in a student's name, it fetches their entire academic profile. It shows their topic grades, overall computing skills, and even tracks their self-reported "confidence ratings". This allows for highly nuanced conversations about their performance.
Alternative Case Study: Year 12 Economics
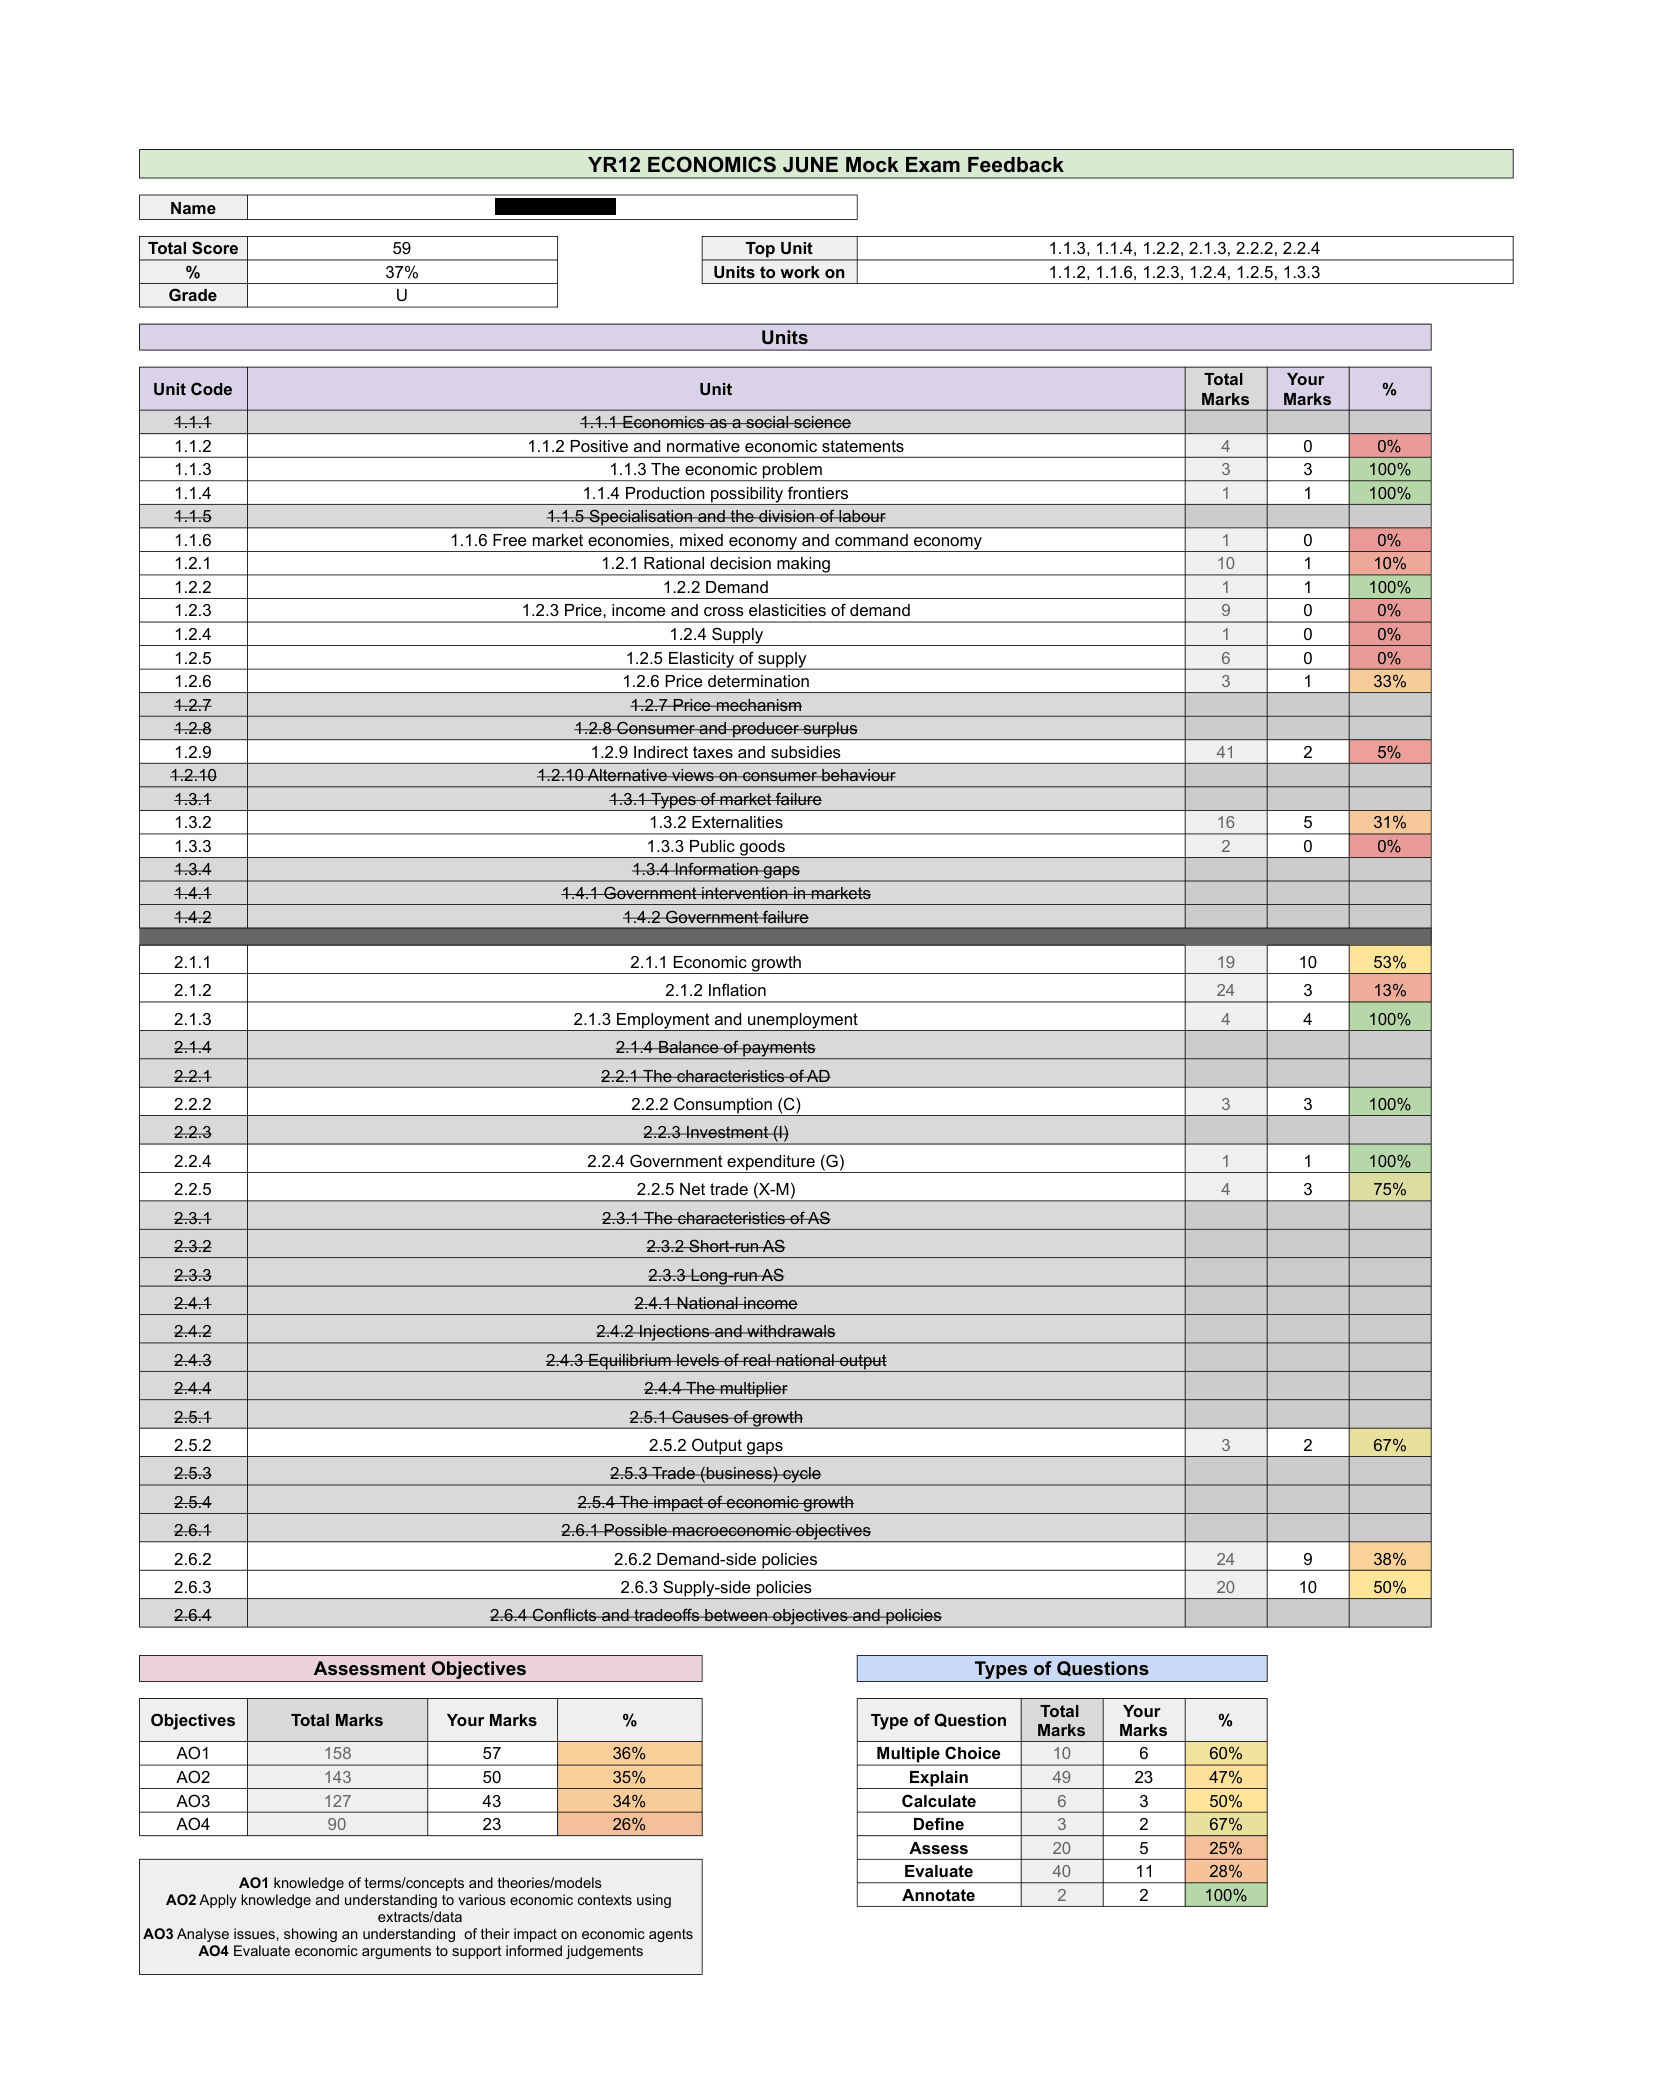
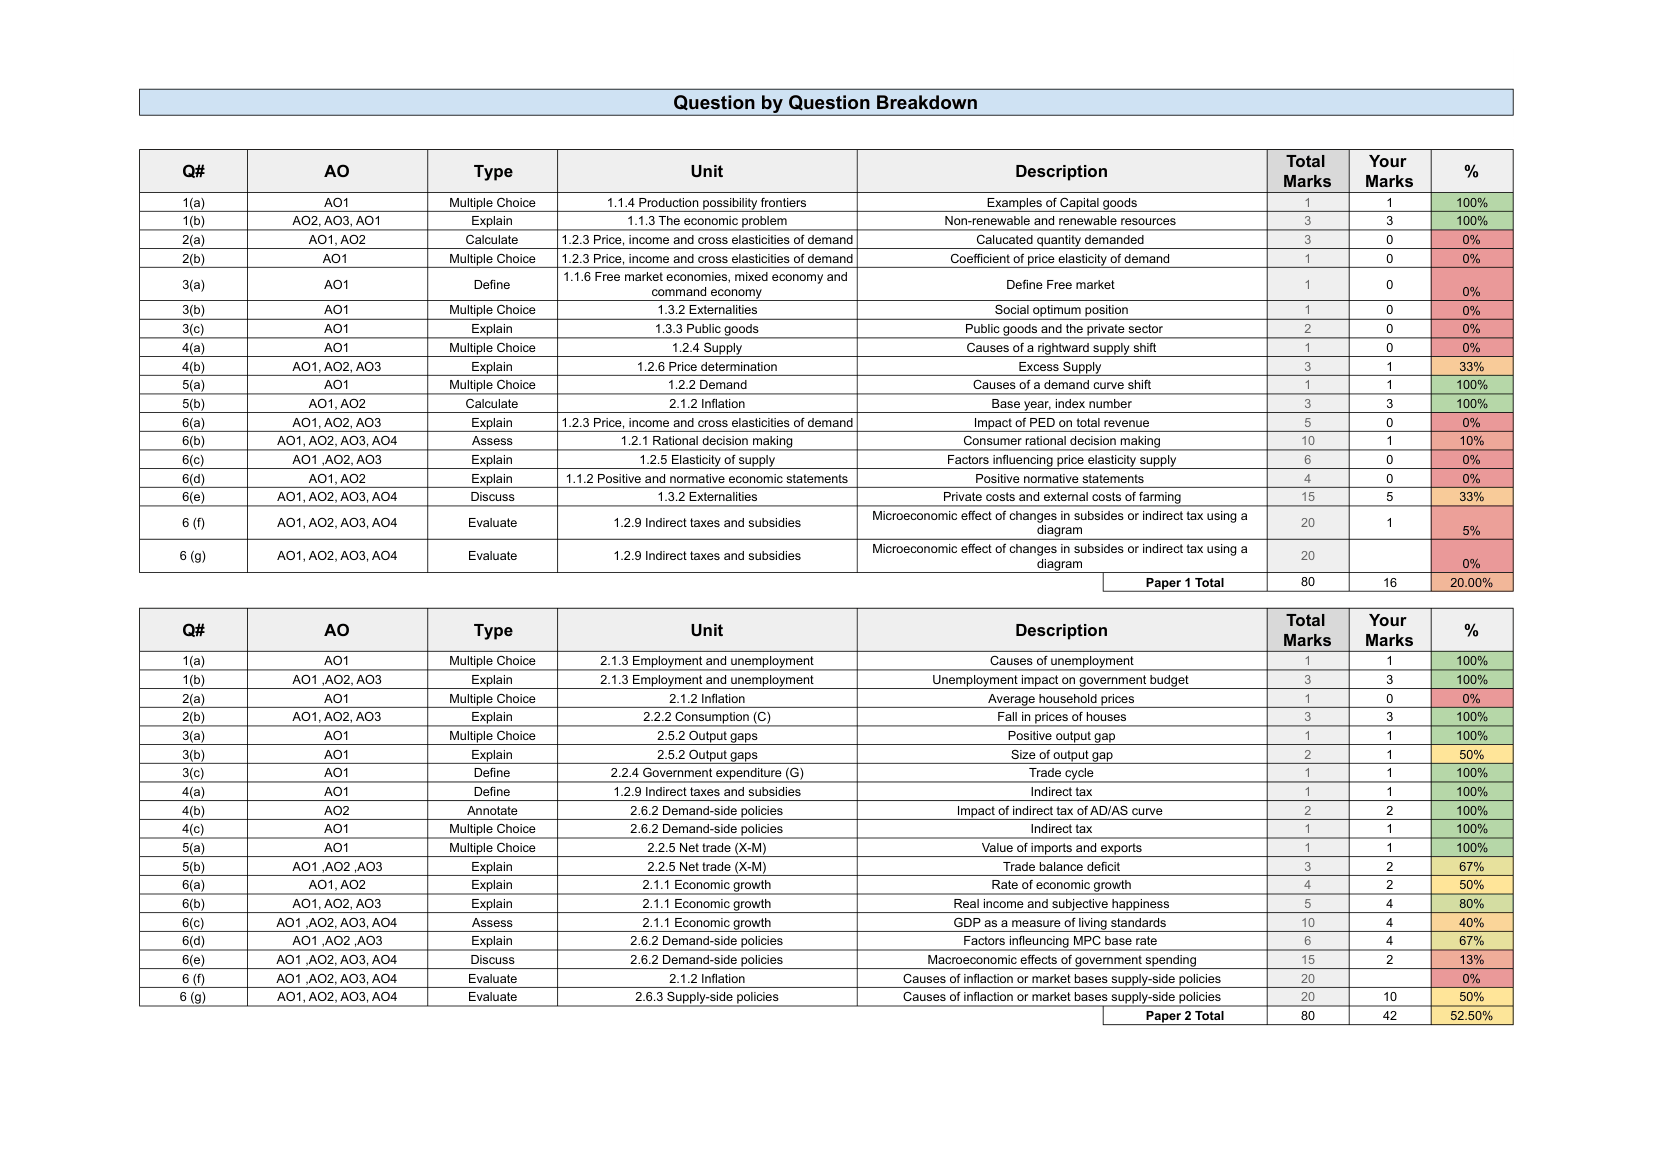
This system was not just limited to Computing. To test its scalability, I applied the system out to the Business and Economics faculty for their Year 12 Economics mock examinations in June. By simply updating the 'EXAM DETAILS' sheet with their specific topics and question weightings, the system automatically generated the same 'PUPIL ANALYSIS' and 'FEEDBACK SHEETS'.
Departmental Outcomes
The impact of this project was felt immediately across the faculty.
"This detailed analysis proved incredibly fruitful for the Computing and IT department; it allowed us to provide pupils with targeted feedback on their specific areas of weakness... utilising spreadsheet formulas and functions to ensure the system worked seamlessly."
~ Head of Computing
"... students found the QLA easy to use for identifying their strengths and areas for improvement through colour coding. This helped them prioritise the topics they needed to revise for their GCSE assessments."
~ Head of Business
Looking Ahead
While the current iteration of this project successfully achieved what I aimed for, a system like this is never truly finished. Here is a breakdown of the features I may one day integrate:
- Complete Automation via Google Apps Script: Fully automate data importing straight from Google Forms and create a distribution system that emails individualised feedback sheets directly to pupil and parent inboxes.
- Advanced Assessment Analysis: Integrating Horsforth Quadrant modelling to visually identify coasting or underperforming students, and wider Progress 8 metrics.
- Diversifying Assessment and Practical Strands: Introducing long-form written assessments at KS3 (supported by AI marking frameworks) and tracking mechanical skills like 3D Modelling, Design, and Animation.
- Expanding Structured Feedback: Developing comprehensive KS3 End-of-Unit feedback sheets that mirror the GCSE style and embedding self-reflective RAG-rated progress tracking across the entirety of KS4.
Building this system involved many long nights staring at spreadsheets, but it proved that we do not have to choose between rich, actionable feedback and teacher wellbeing. I look forward to continuing to refine how I use data to elevate student outcomes.
Sources
- Black, P., and Wiliam, D. (1998). Inside the Black Box: Raising Standards Through Classroom Assessment.
- Department for Education (2018). School Workload Reduction Toolkit. GOV.UK.
- Hattie, J. (2009). Visible Learning: A Synthesis of Over 800 Meta-Analyses Relating to Achievement. Routledge.
- Schildkamp, K., Lai, M. K., and Earl, L. (2013). Data-based decision making in education. Springer.
- Sweller, J. (1988). Cognitive Load During Problem Solving: Effects on Learning. Cognitive Science.
- Wiliam, D. (2011). Embedded Formative Assessment. Solution Tree Press.
- Education Endowment Foundation (2021). Teacher Feedback to Improve Pupil Learning.
- Rosenshine, B. (2012). Principles of Instruction: Research-Based Strategies. American Educator.